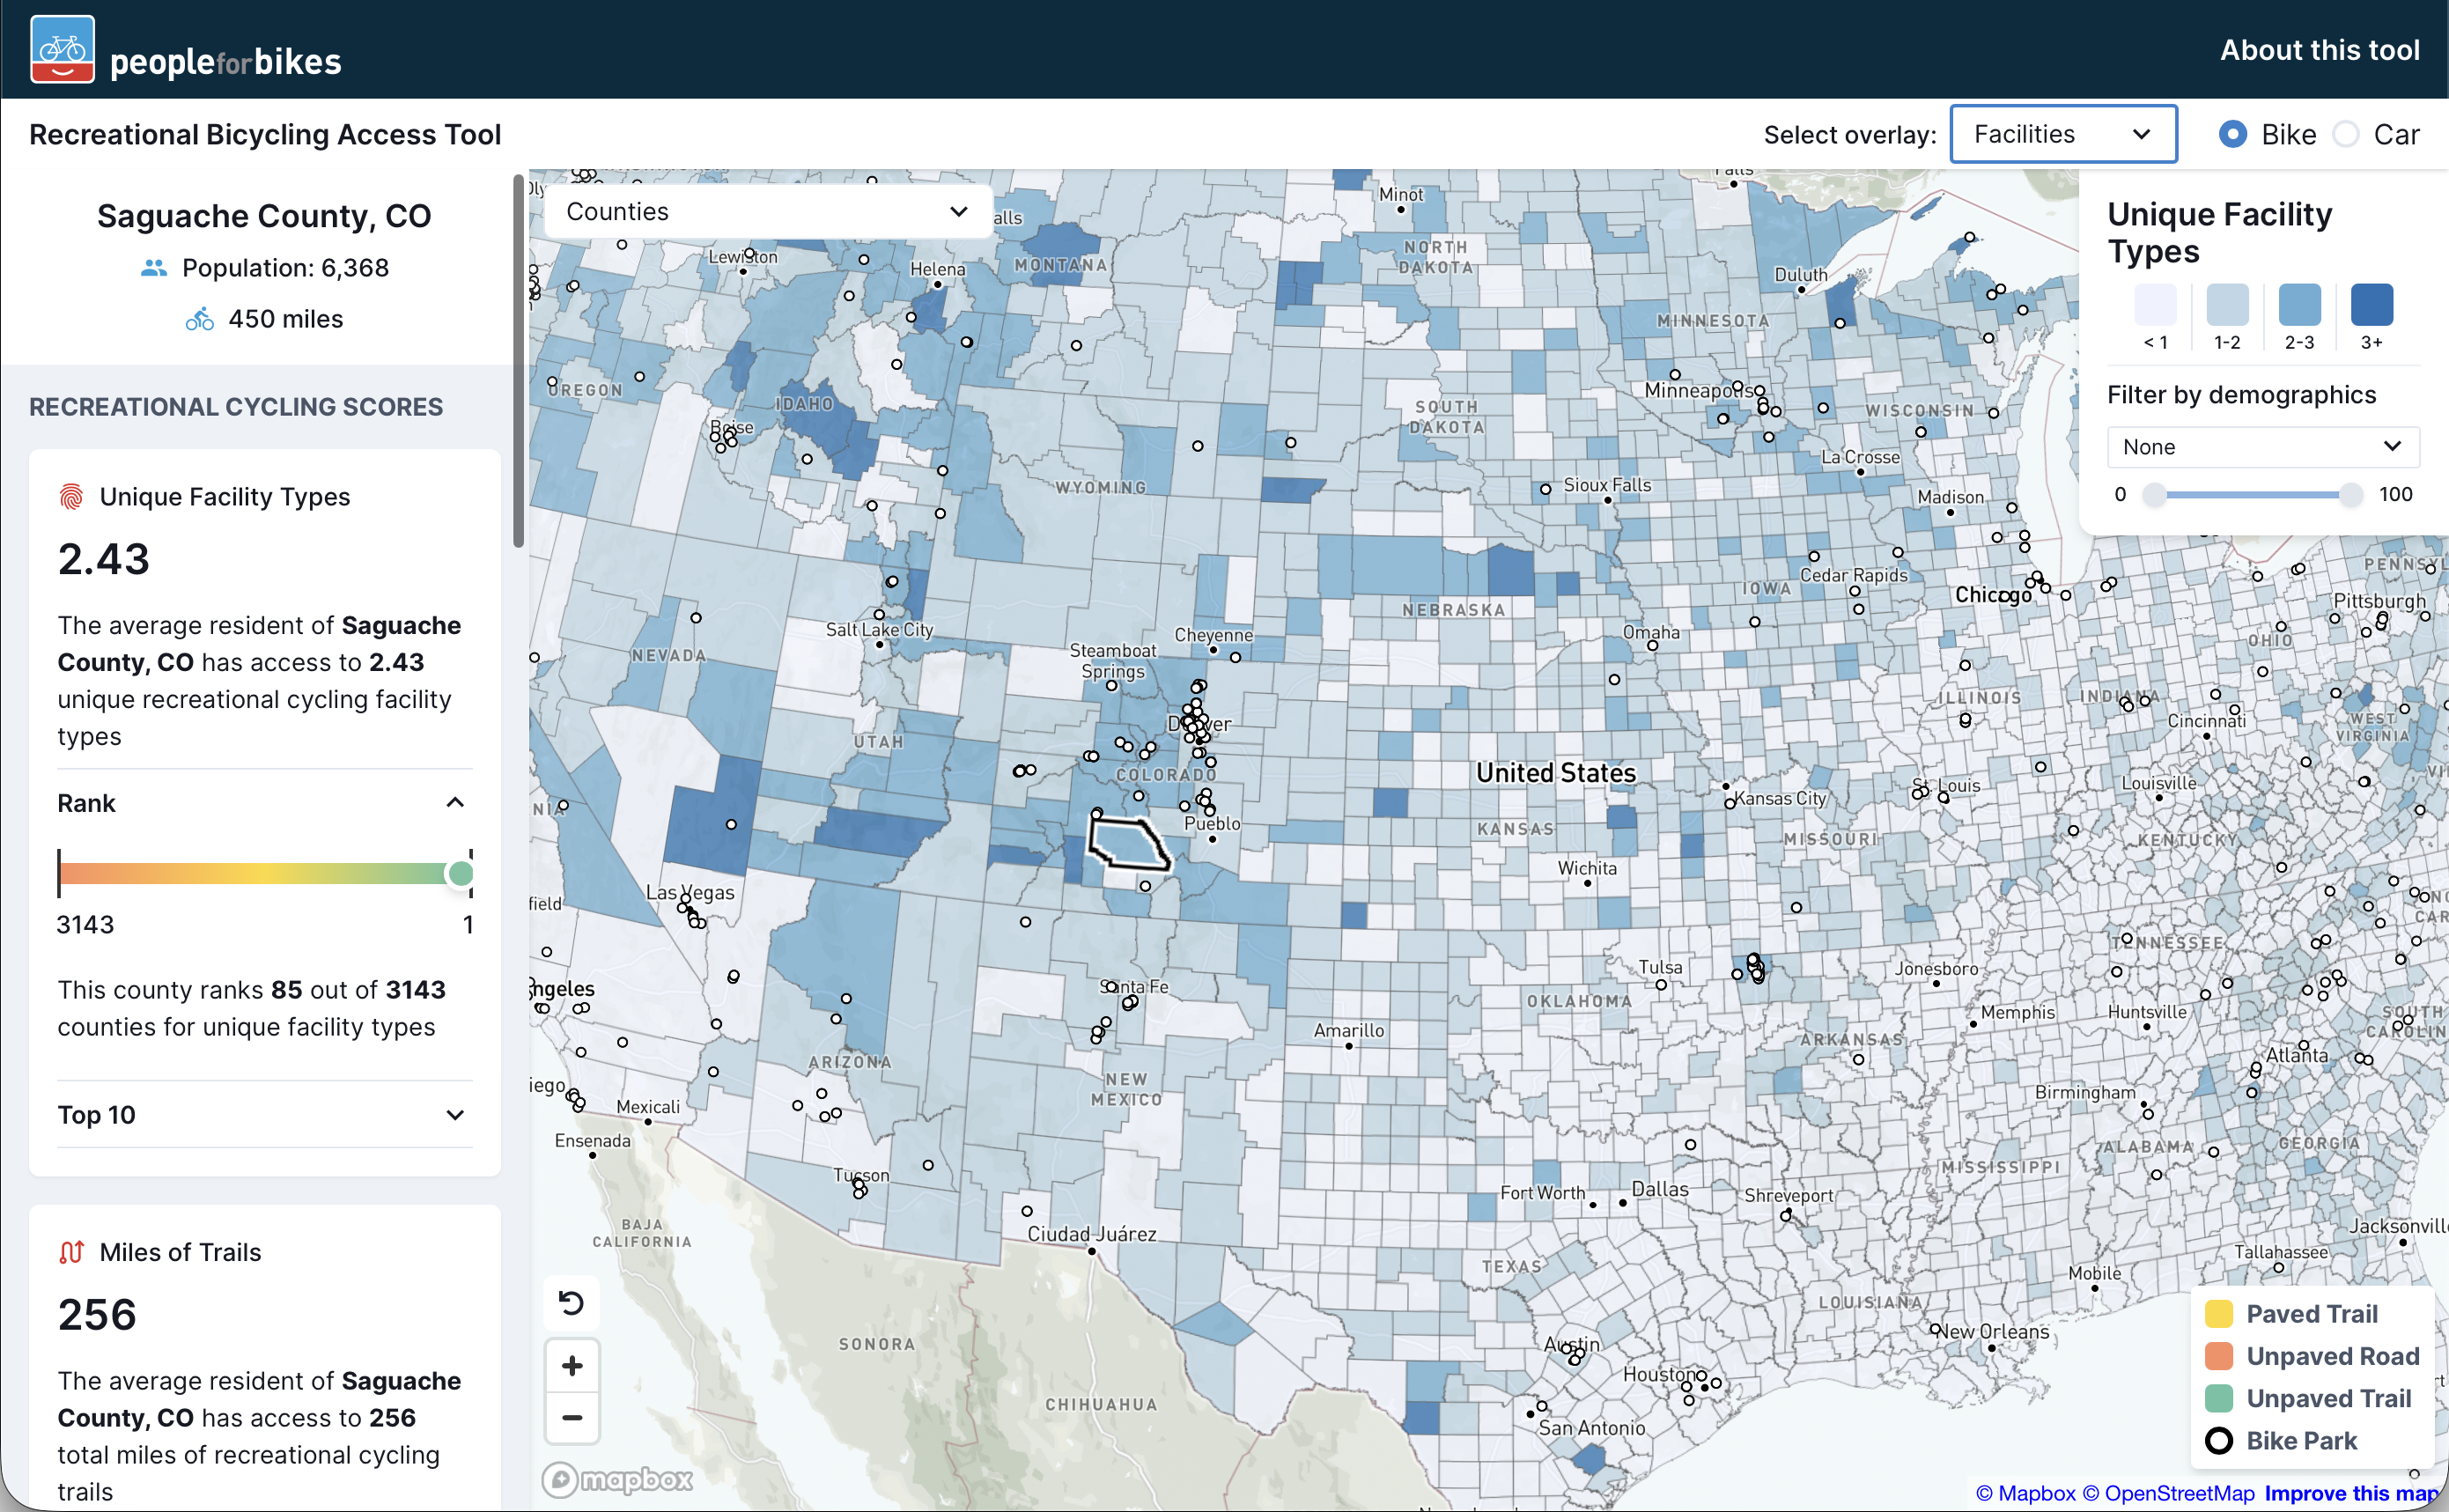
Recreational Bicycling Access Tool
A first-of-its-kind platform that quantifies access to recreational bicycling facilities across the United States to support data-driven infrastructure investments
PeopleForBikesRecreation
A first-of-its-kind platform that quantifies access to recreational bicycling facilities across the United States to support data-driven infrastructure investments
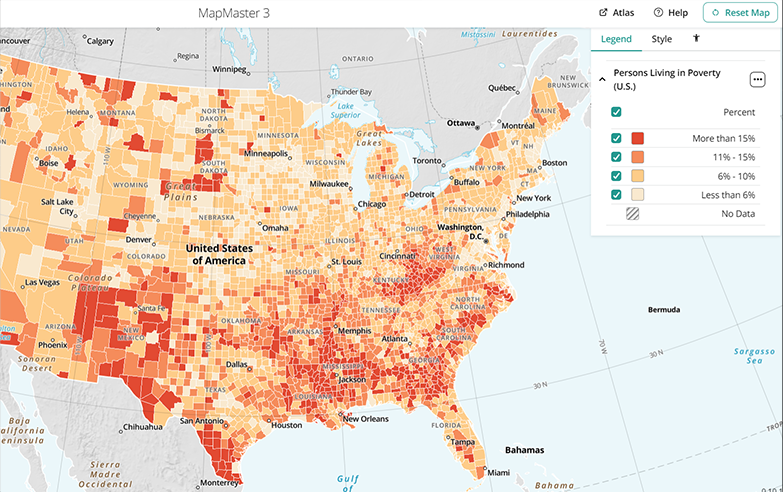
A completely redesigned interactive mapping platform enabling students to layer thematic maps and analyze spatial patterns at regional and global scales
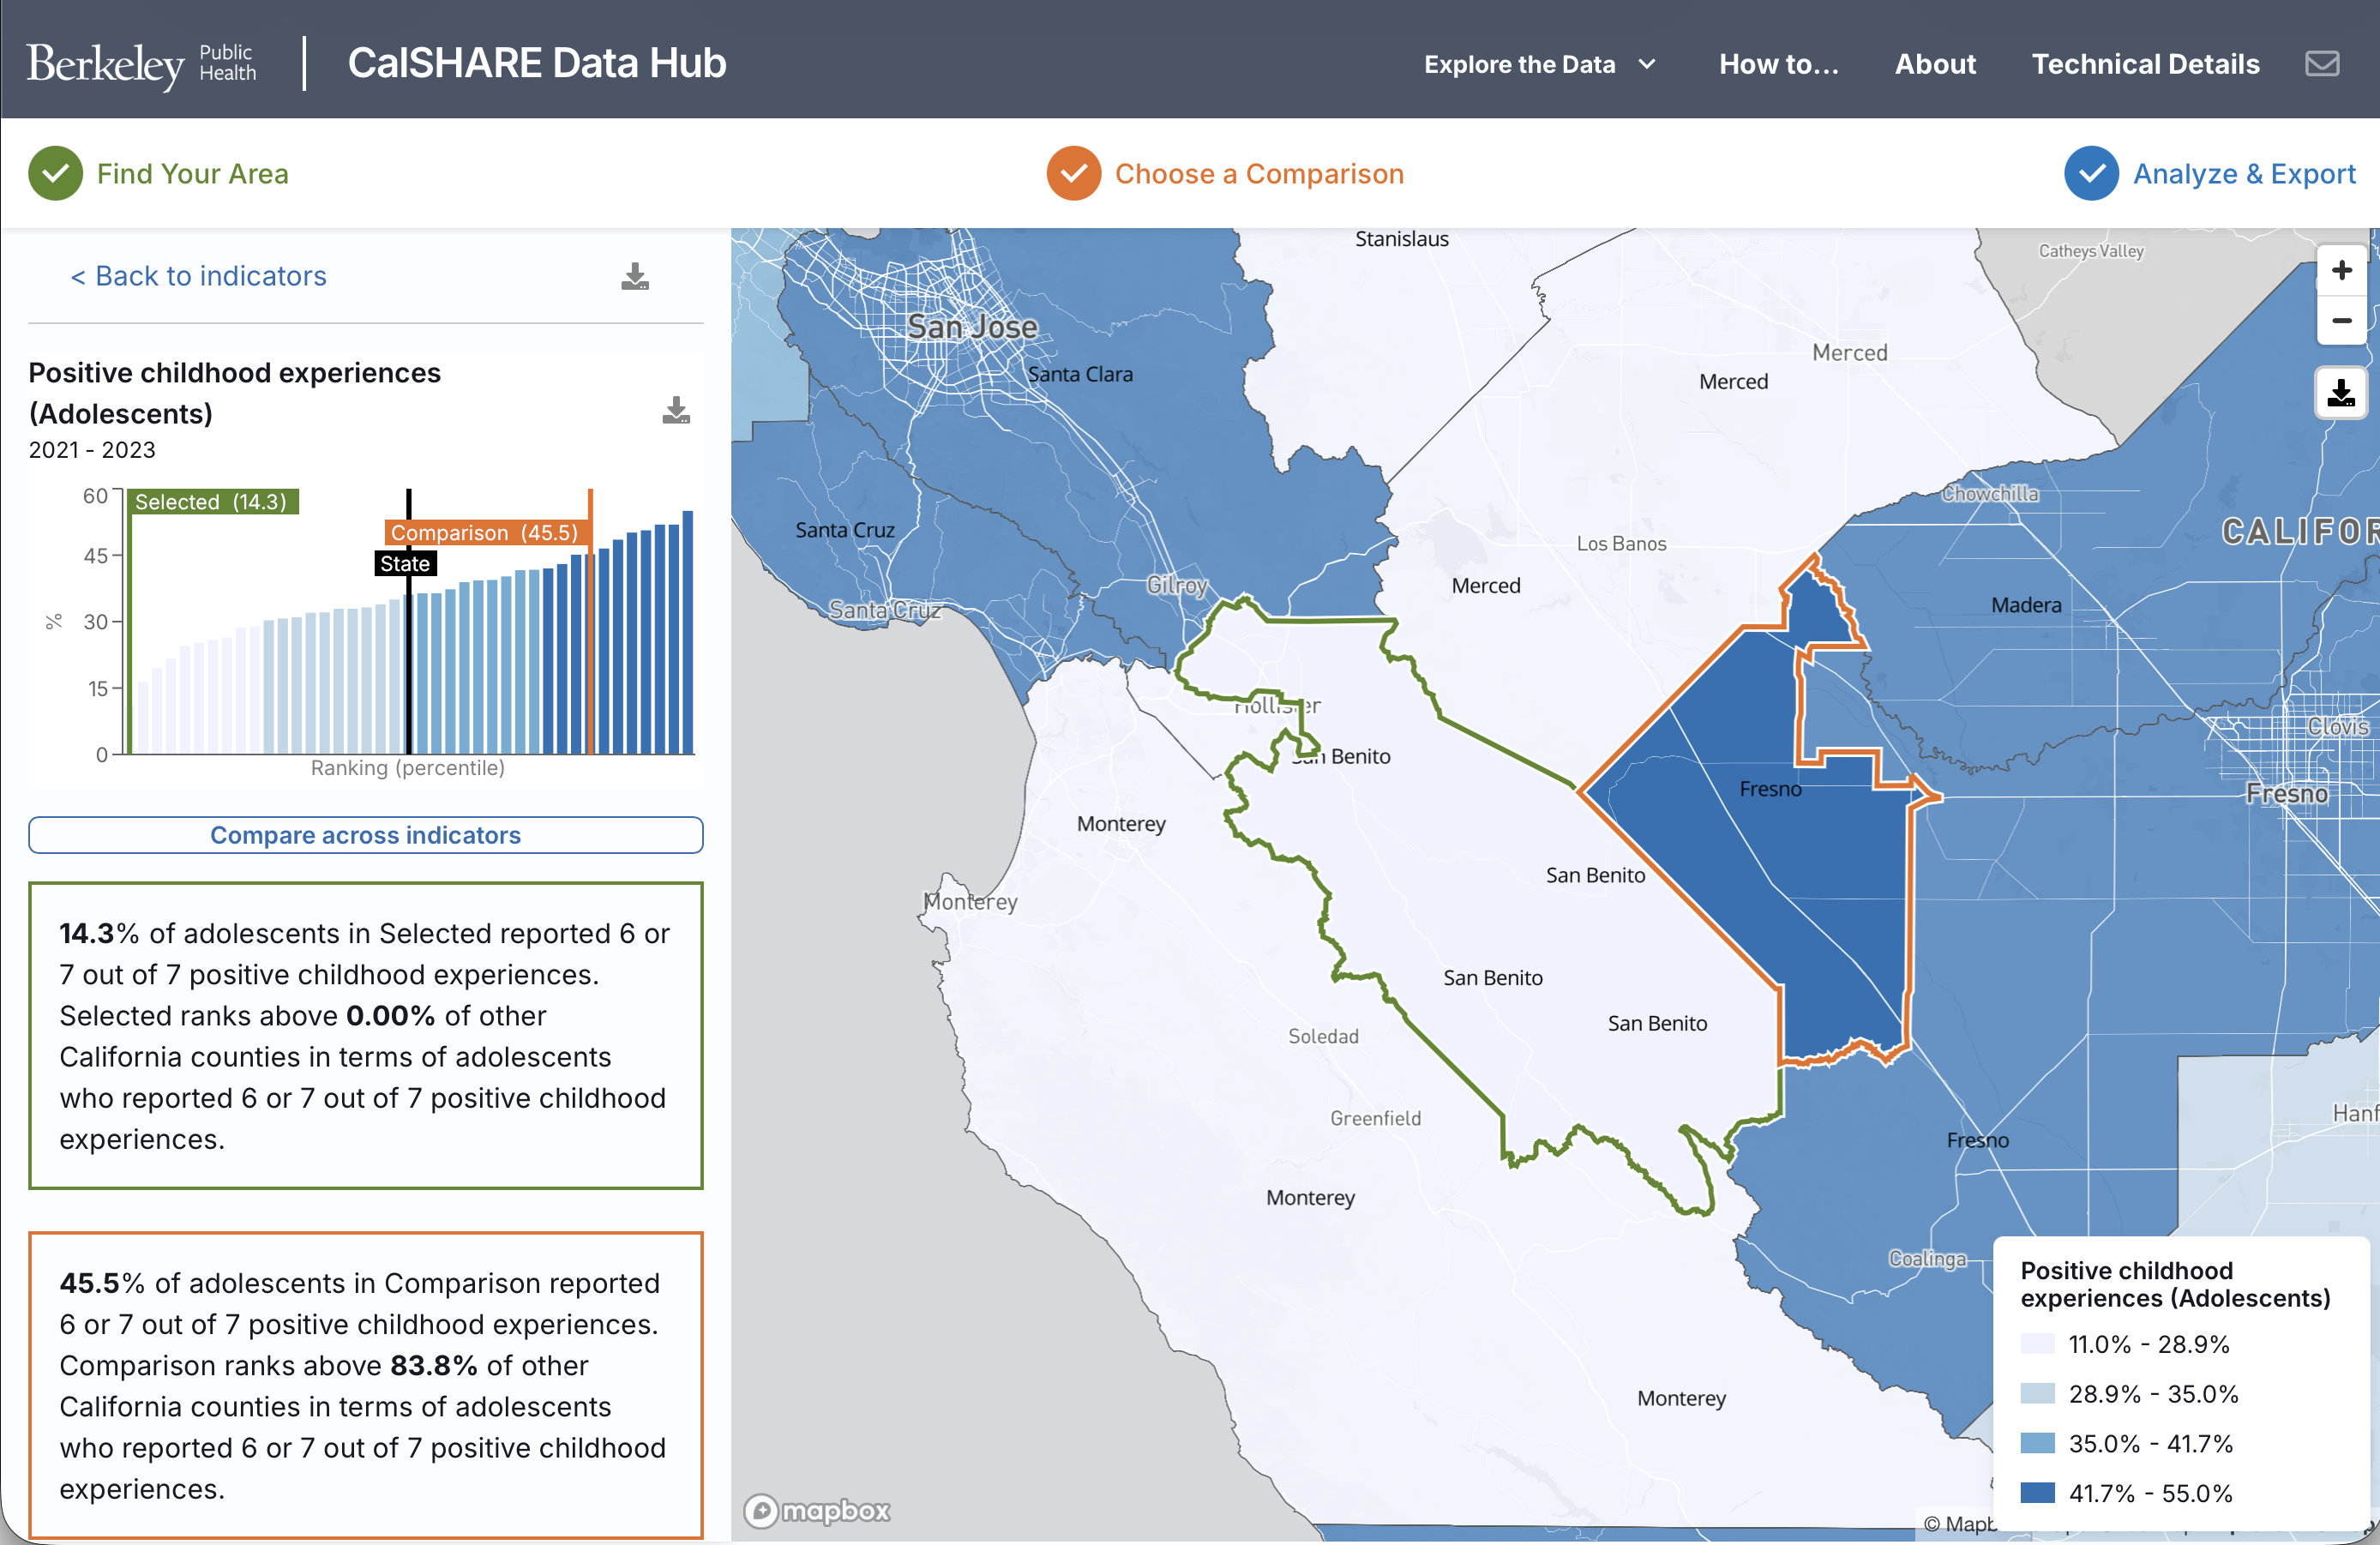
An interactive platform providing health and safety insights to understand strengths and challenges in local communities across California
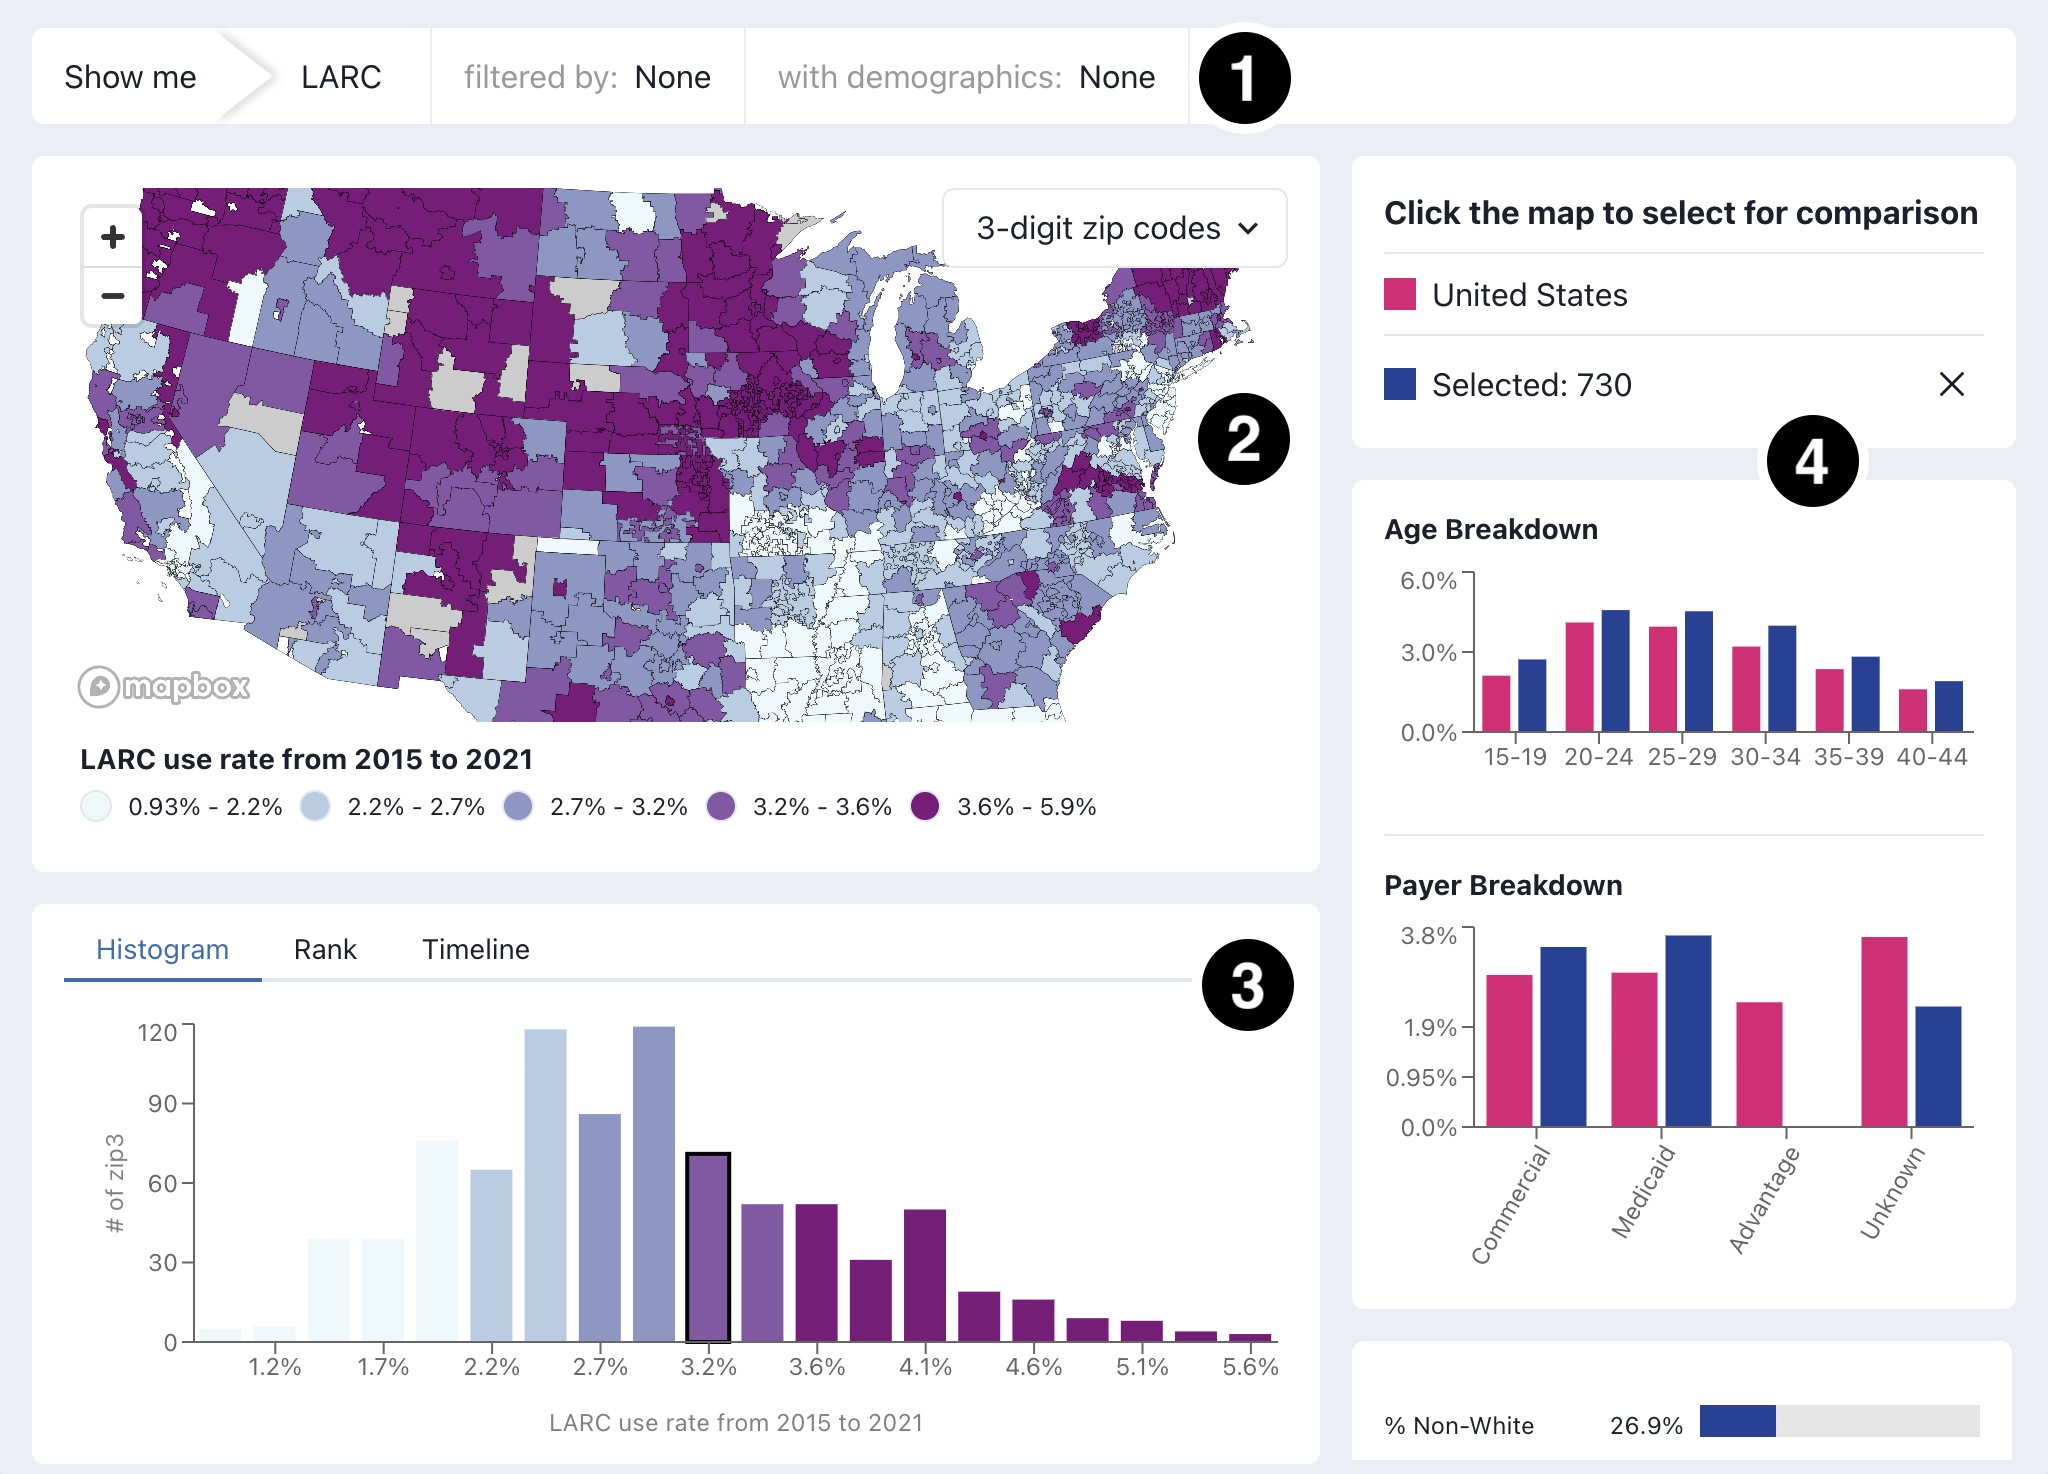
An interactive mapping platform revealing socio-demographic and geographic disparities in LARC insertion across the United States
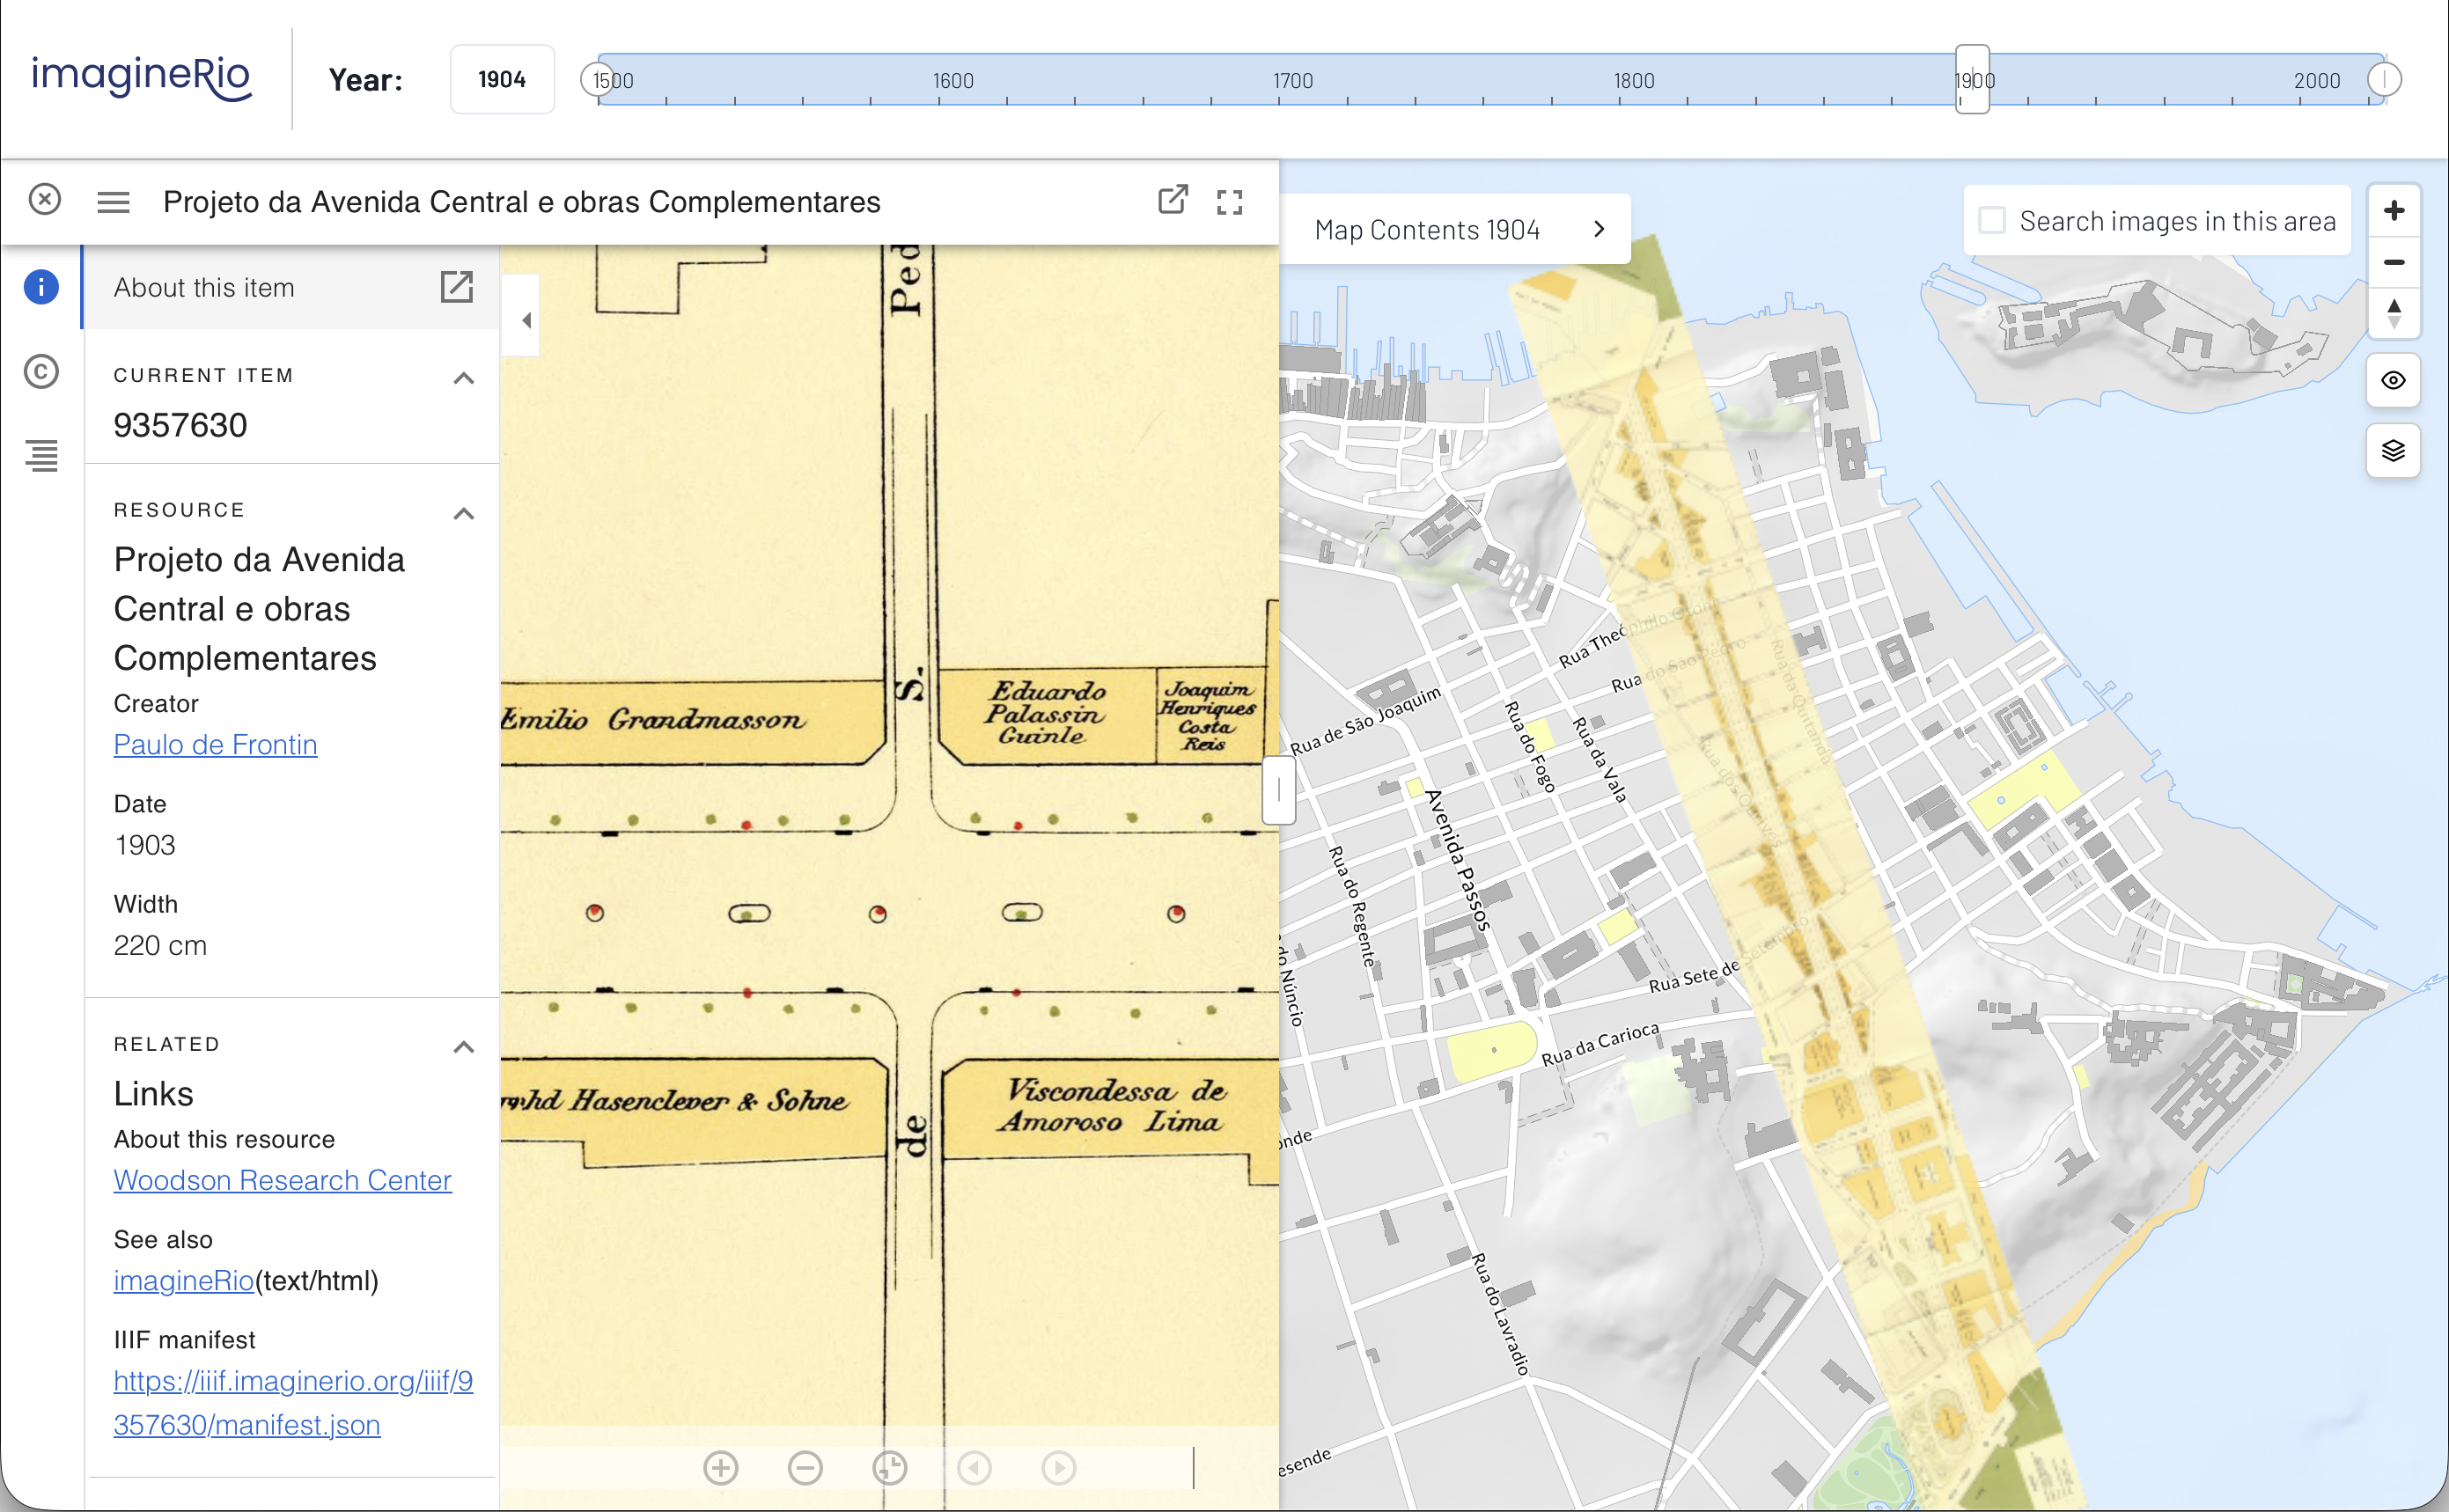
An interactive platform illustrating the urban and social evolution of Rio de Janeiro from 1500 to the present day through maps, views, and architectural plans
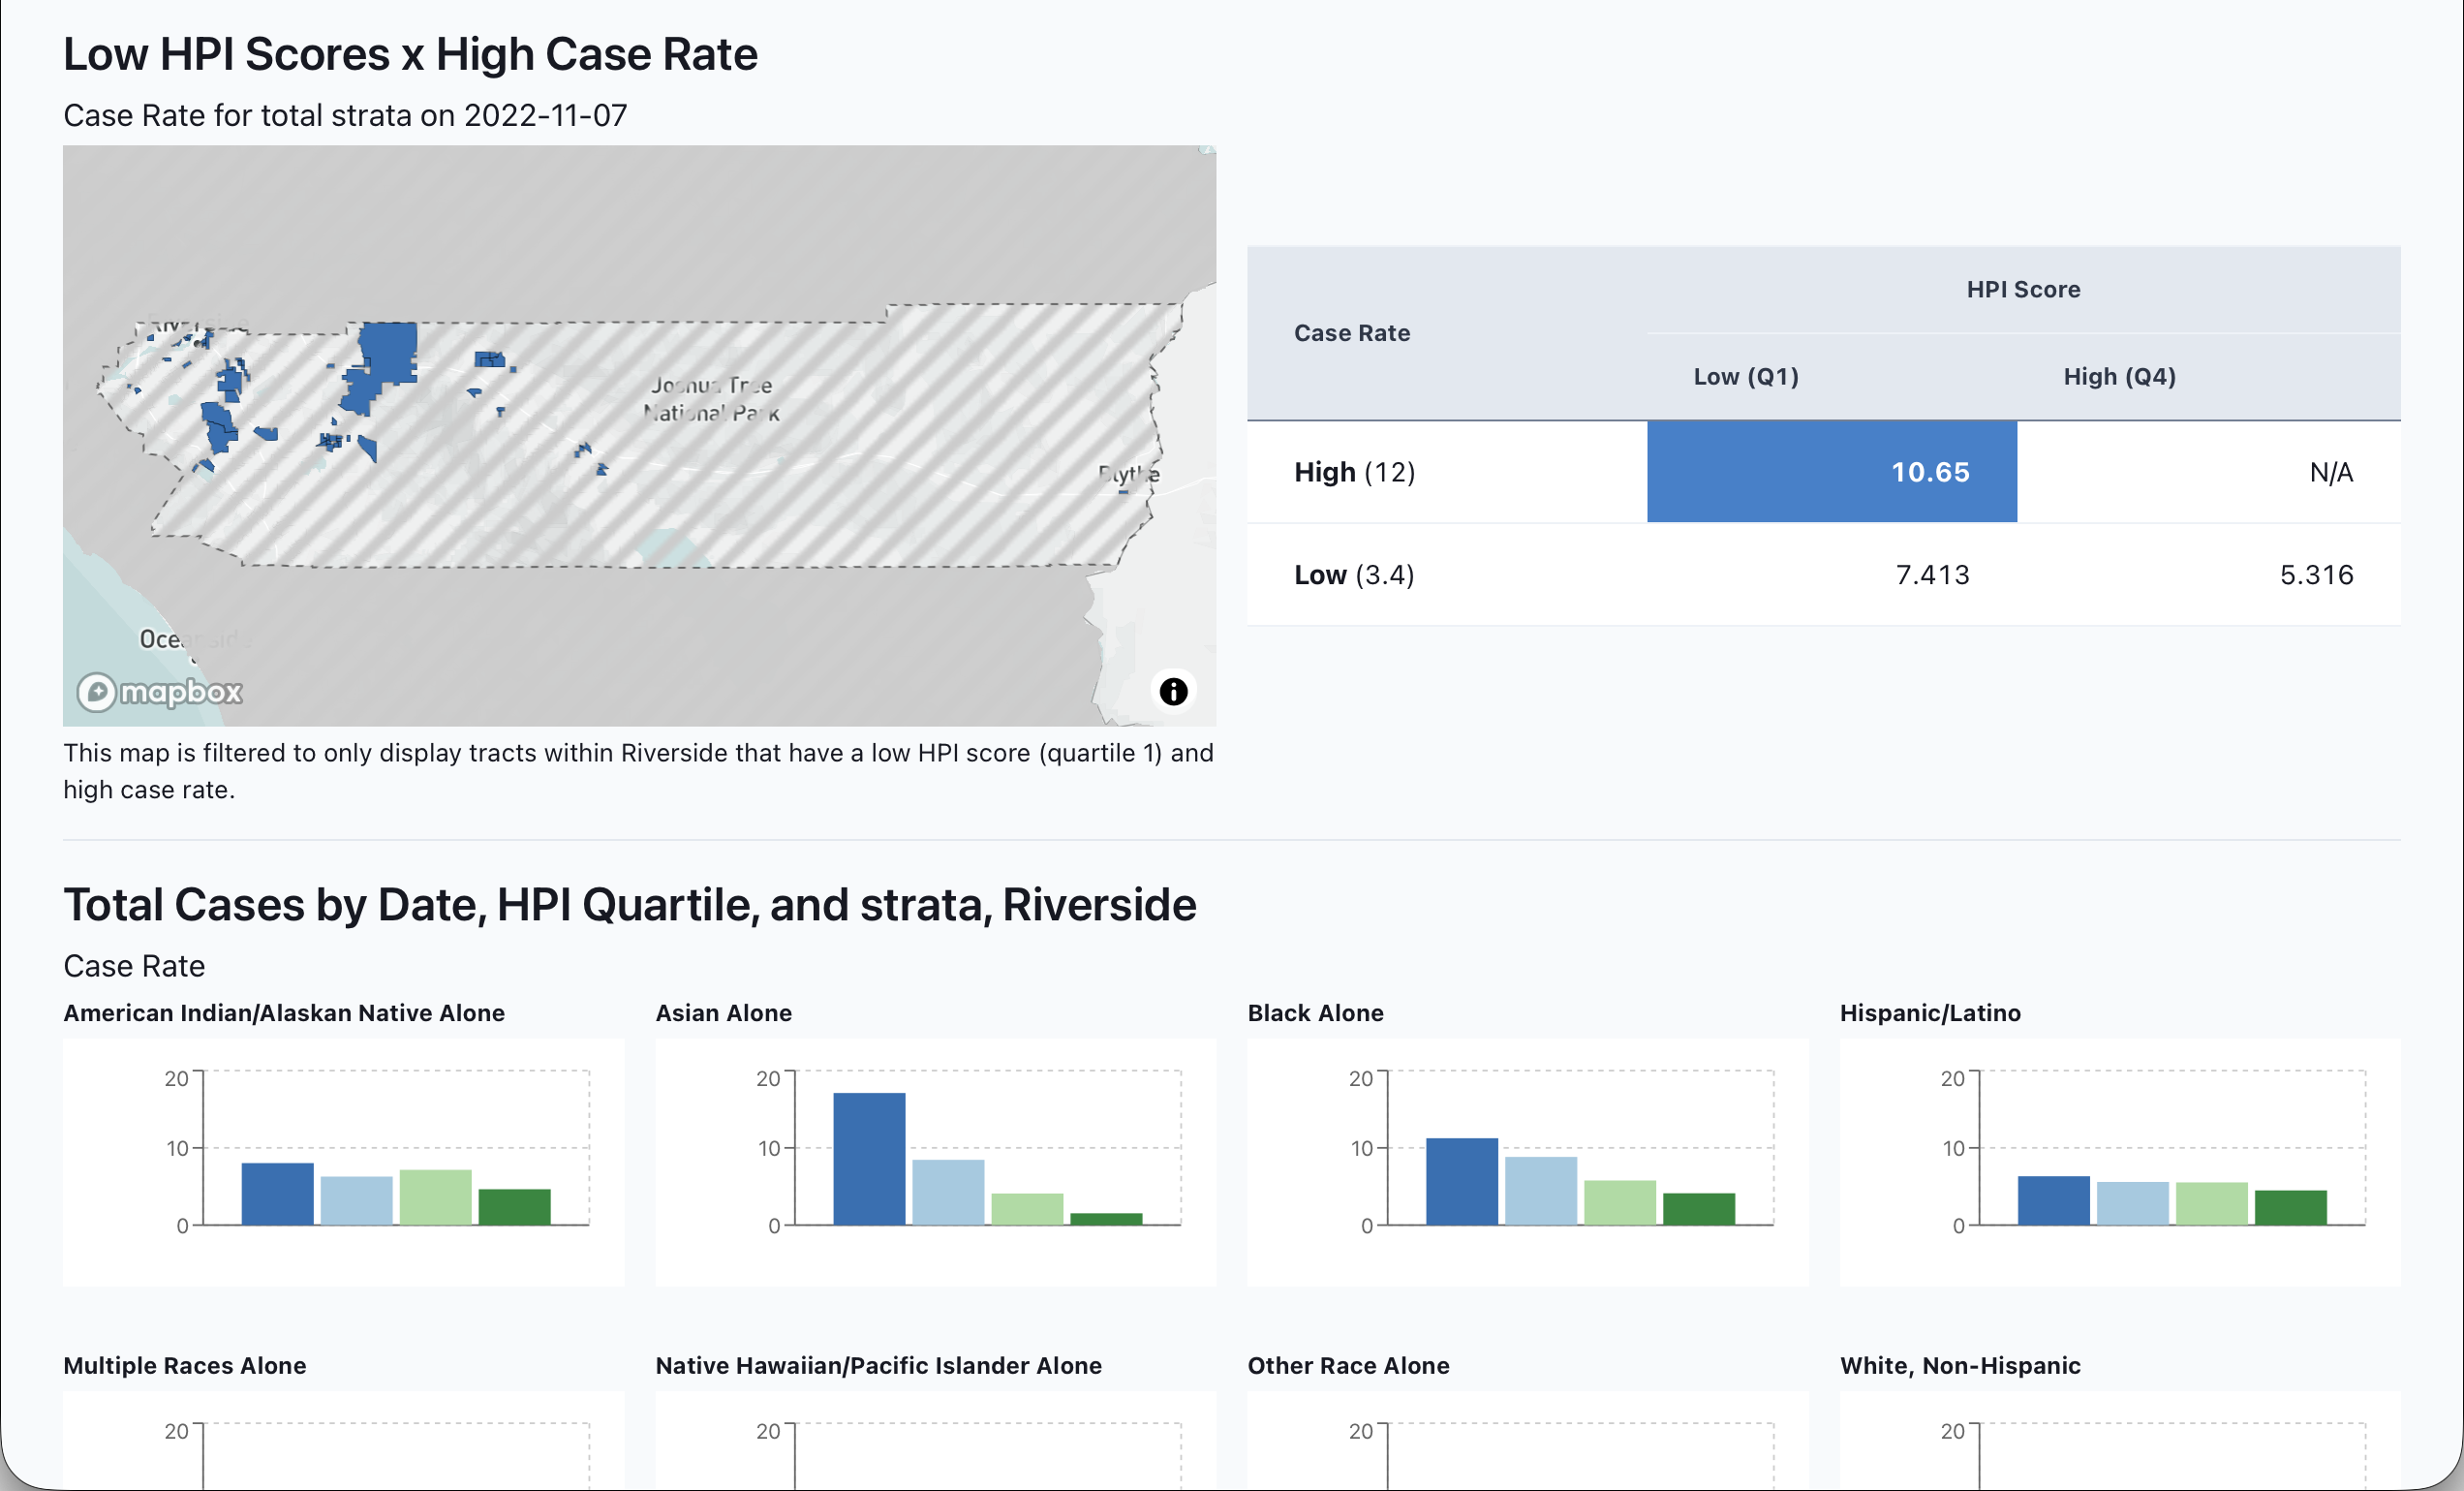
A platform enabling health departments to analyze surveillance data through an equity lens by integrating health outcomes with the Healthy Places Index
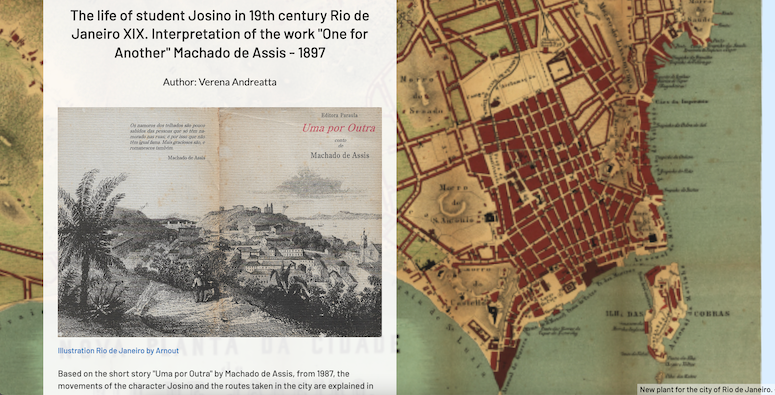
A bilingual storytelling application enabling users to craft spatial narratives about Rio de Janeiro without requiring GIS expertise
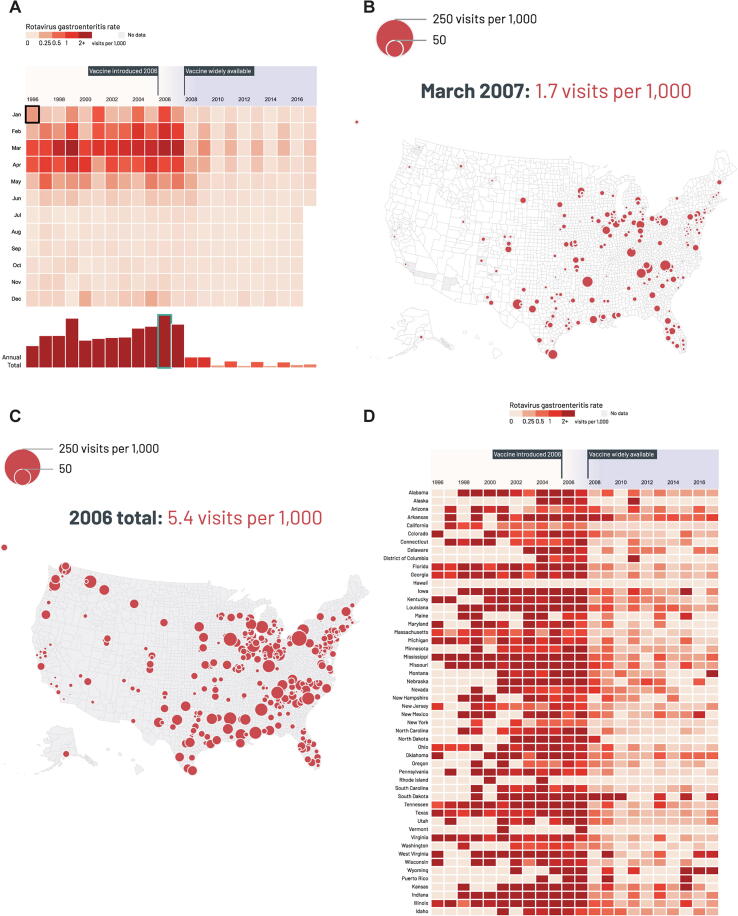
A comprehensive web platform demonstrating the dramatic impact of rotavirus vaccination on pediatric health outcomes across the United States from 1996 to 2017

Interactive scrolling map chronicling Ulysses S. Grant's key Civil War battles from Fort Donelson to Appomattox, featuring dramatic animations of troop movements and battle outcomes.
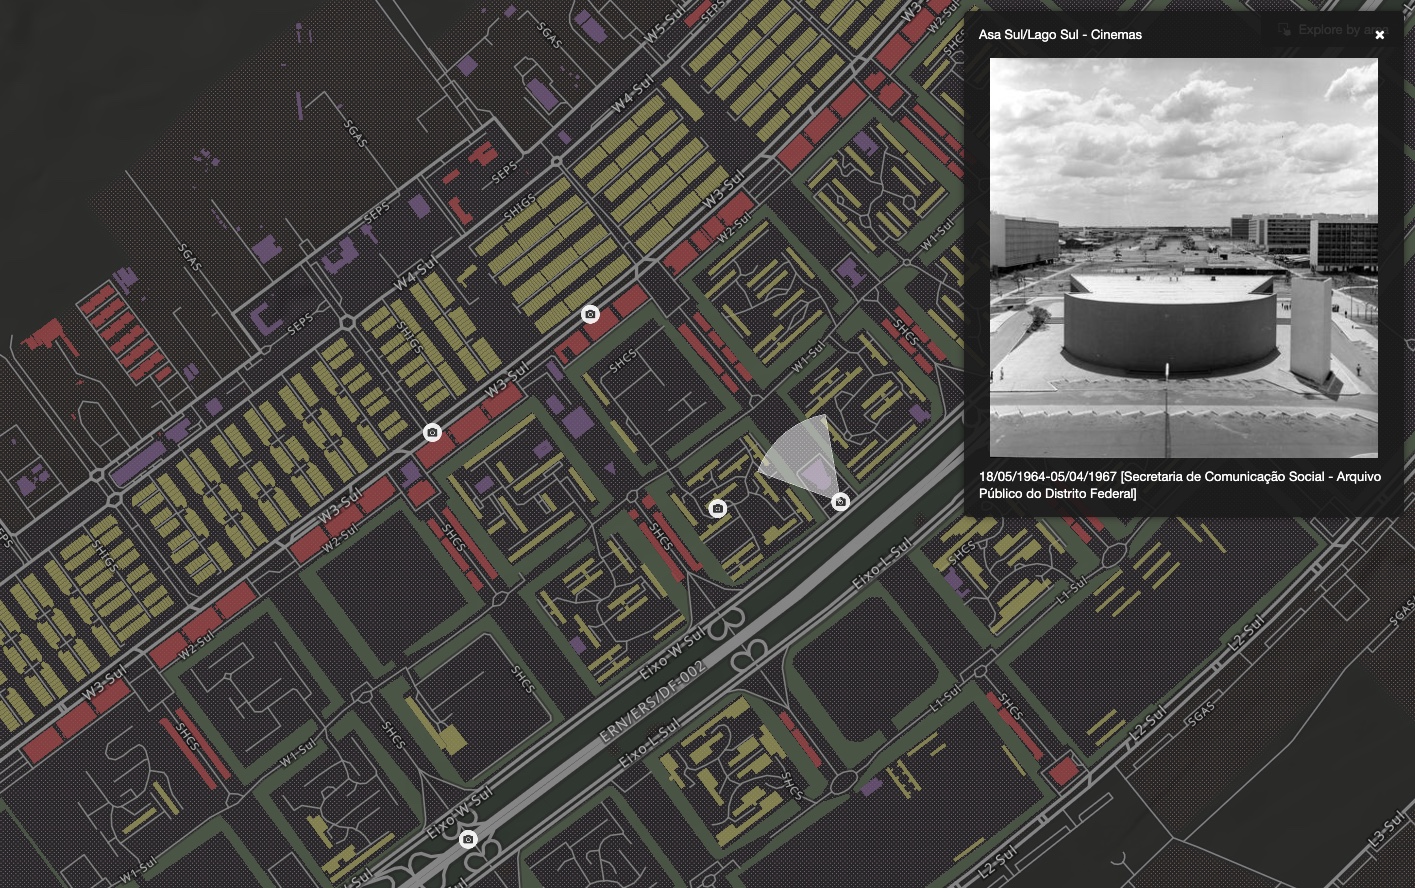
pilotPlan is a searchable digital atlas that illustrates the urban and architectural evolution of Brasilia, as it existed and as it was imagined.
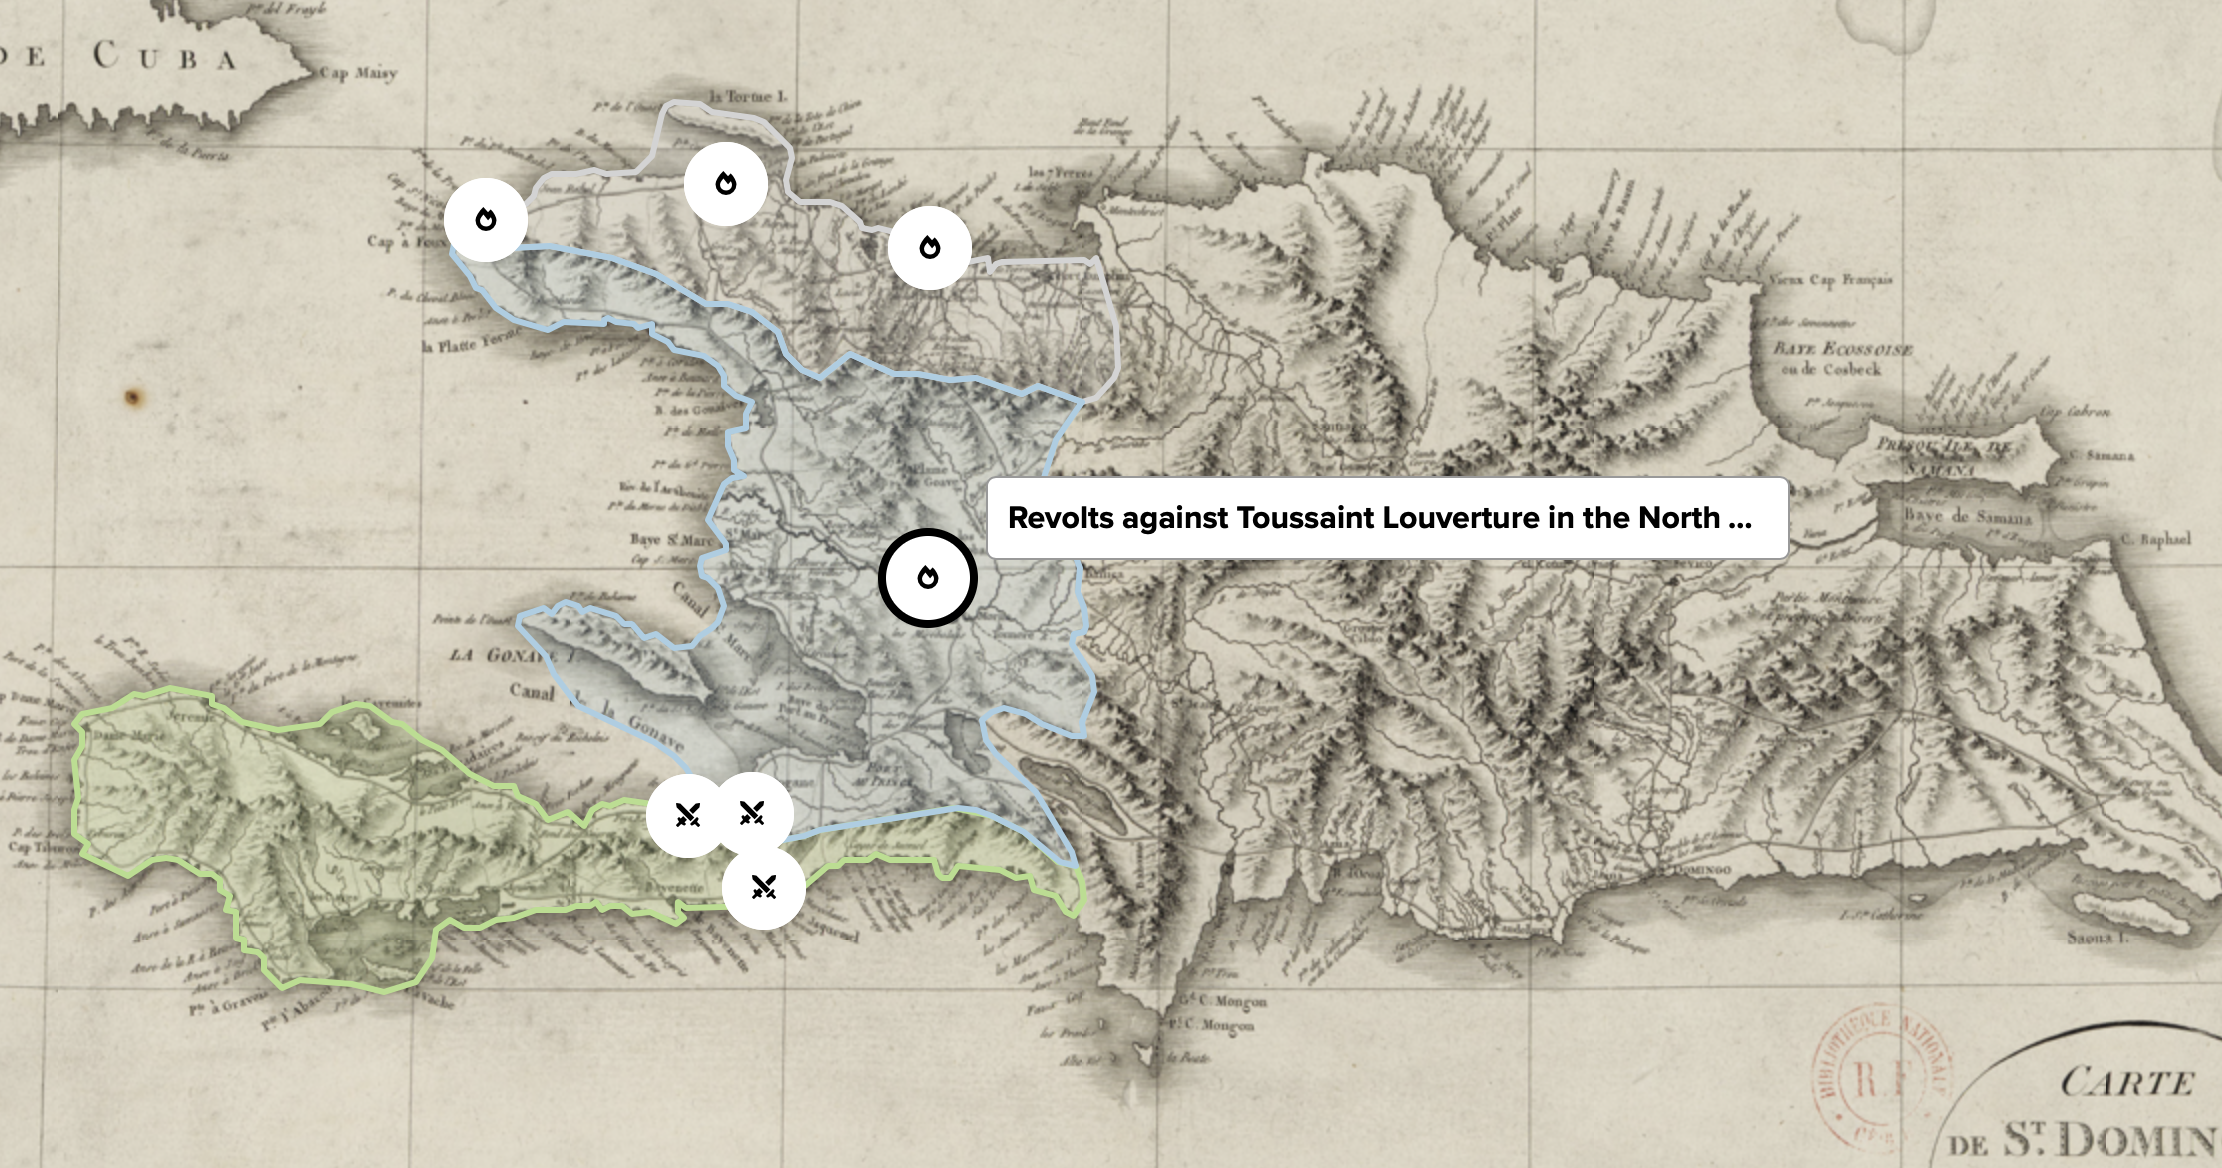
Understanding the complicated narrative of the Haitian Revolution across time and space
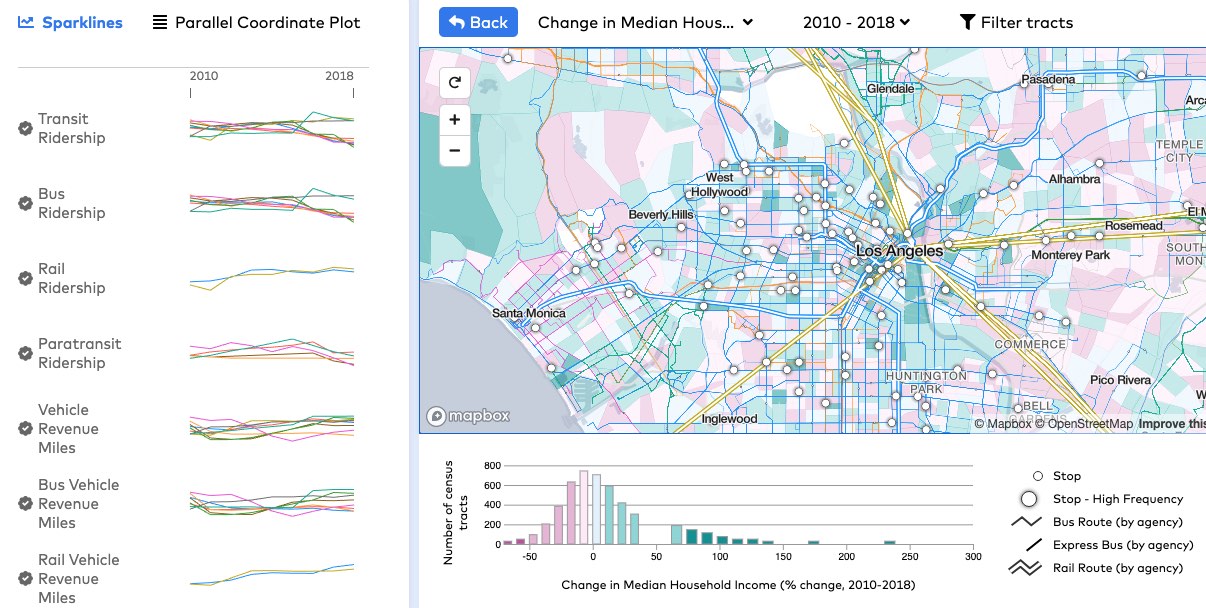
An interactive visualization of demographic and transit ridership trends over time in 55 US metropolitan areas.
The Public Health Alliance of Southern California, a non-profit public health foundation, contracted us to update and modernize their Healthy Places Index mapping tool.
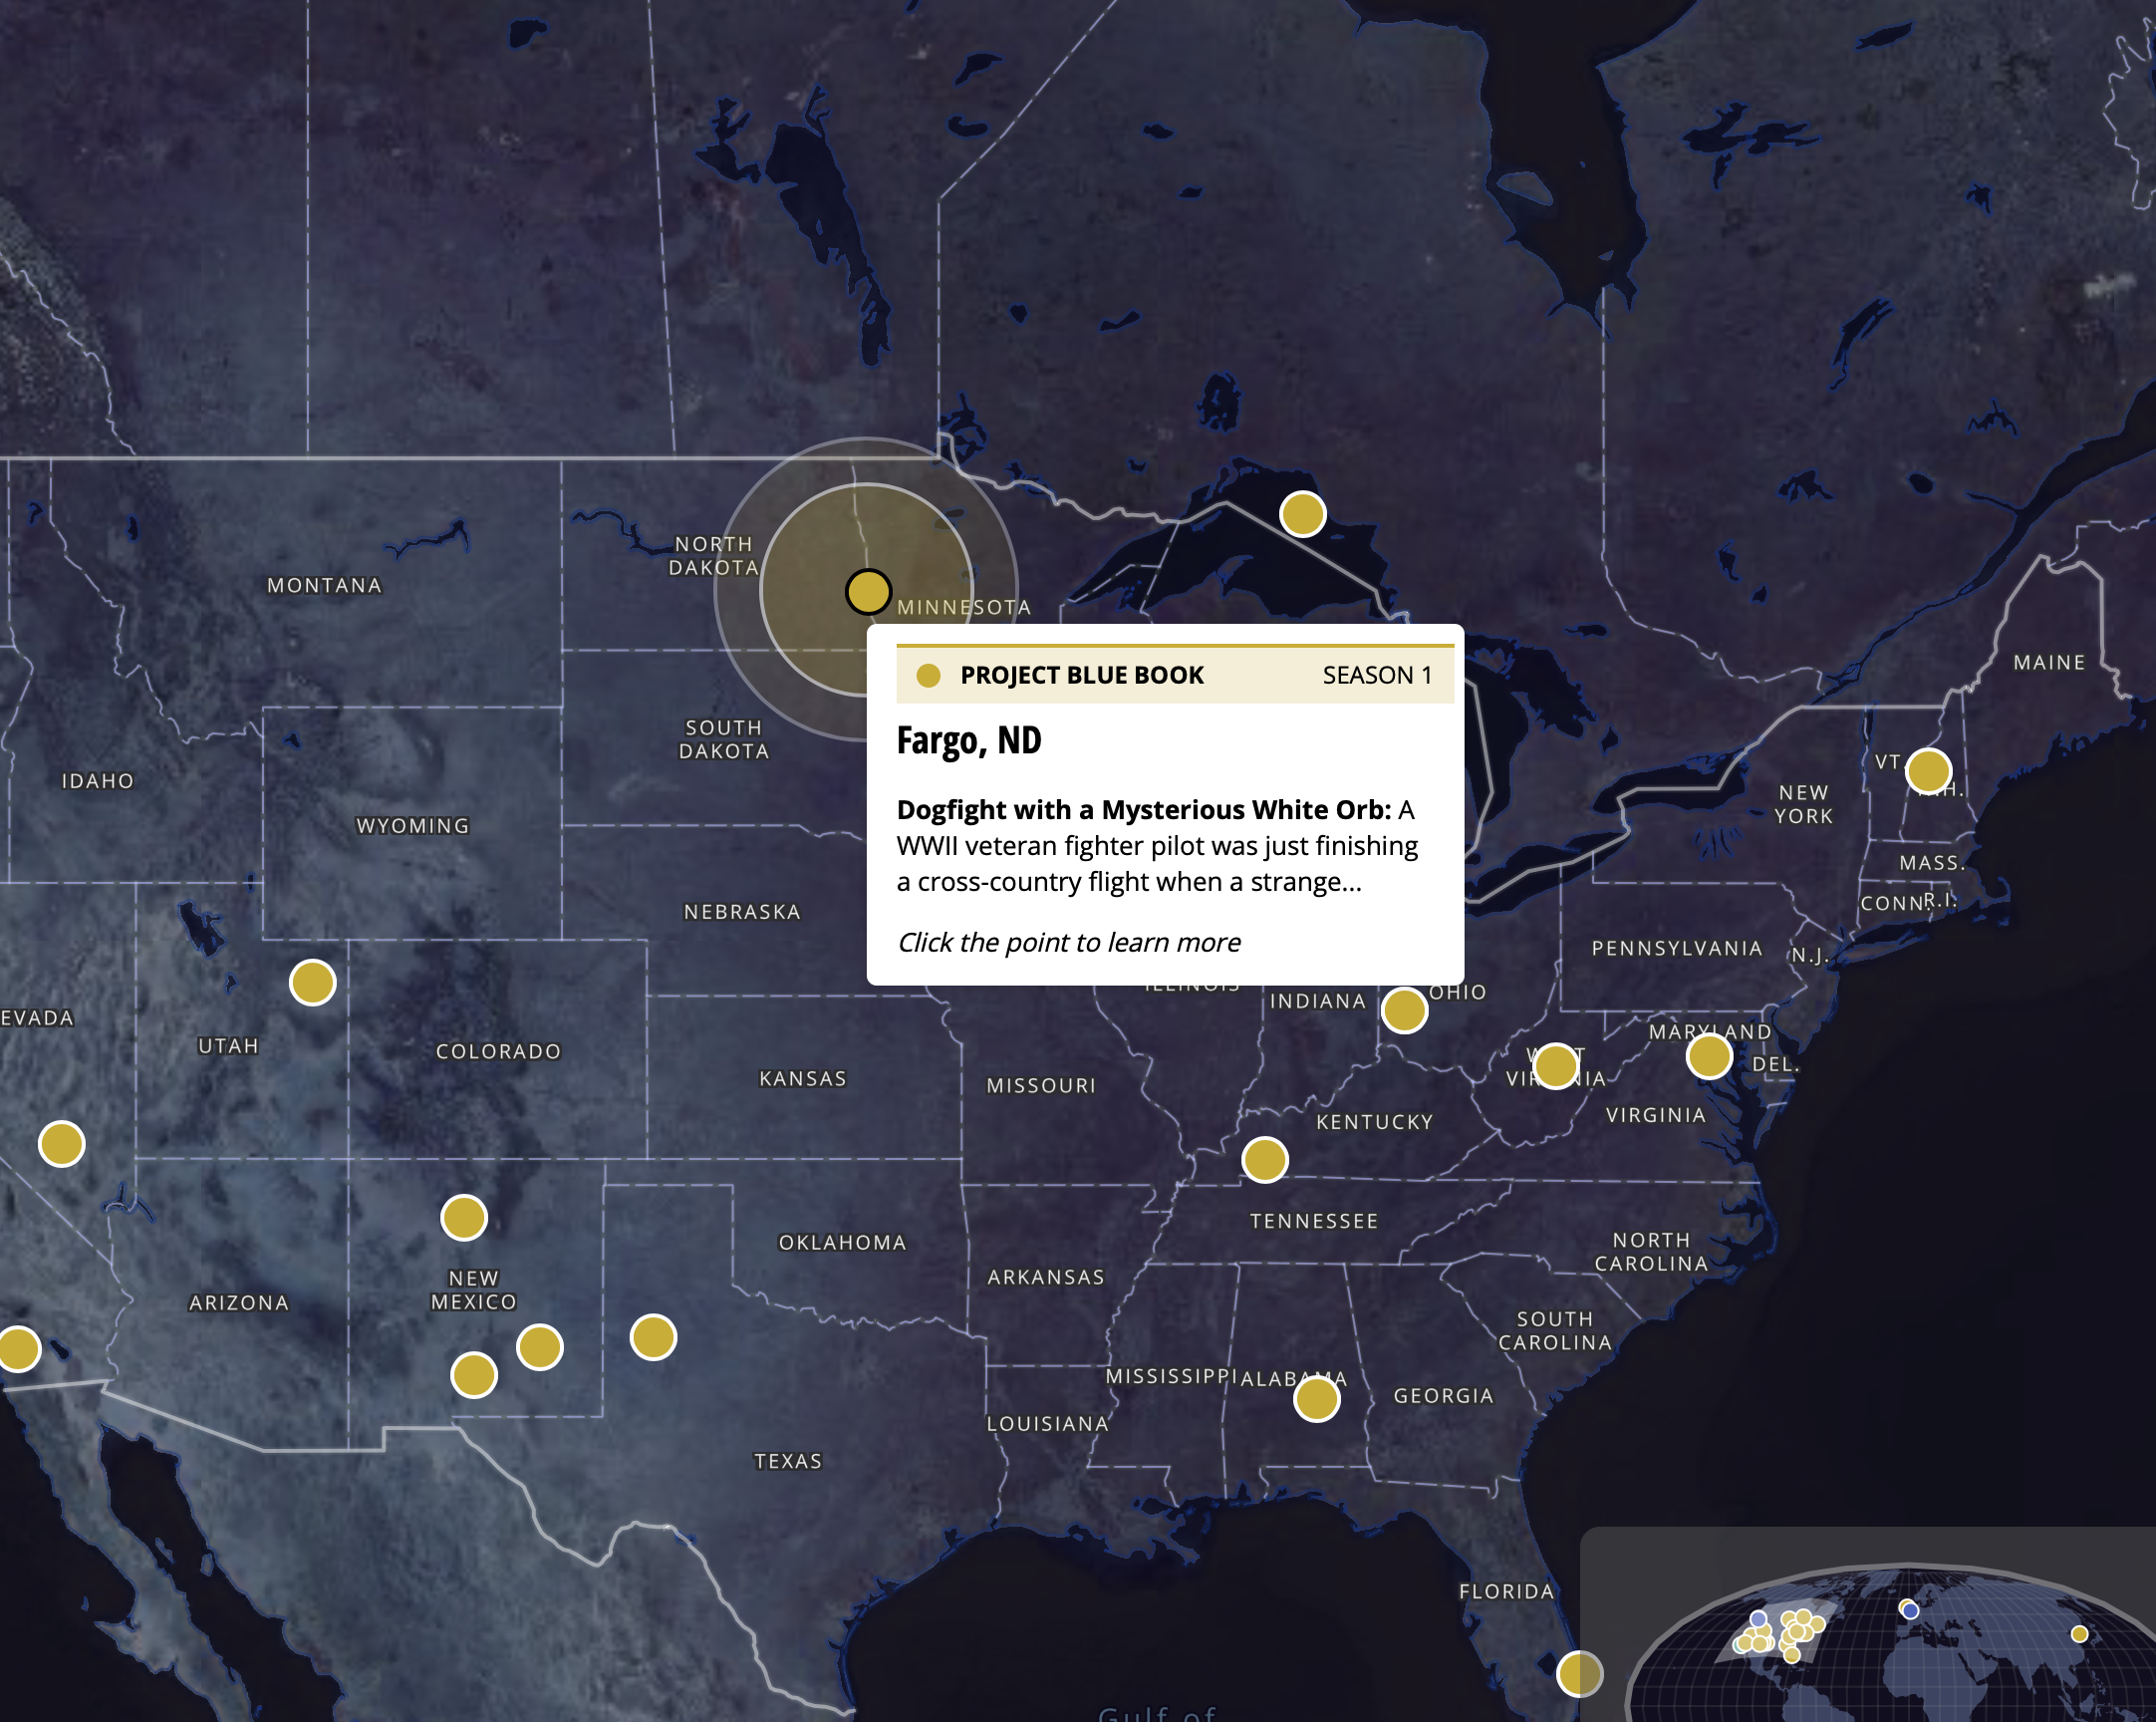
We partnered with the HISTORY to create an interactive map for Project Blue Book, one of the network’s priority scripted dramas.
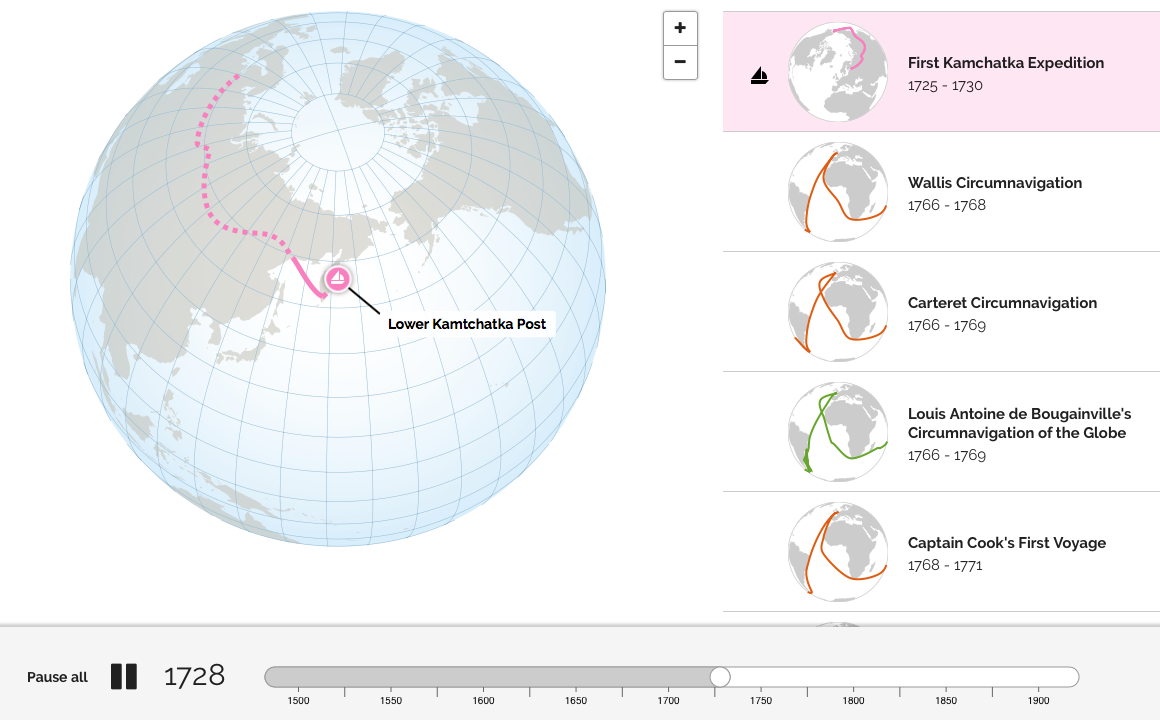
This map was produced as part of the Age of Exploration project in collaboration with our longtime partners at Adam Matthew Digital.
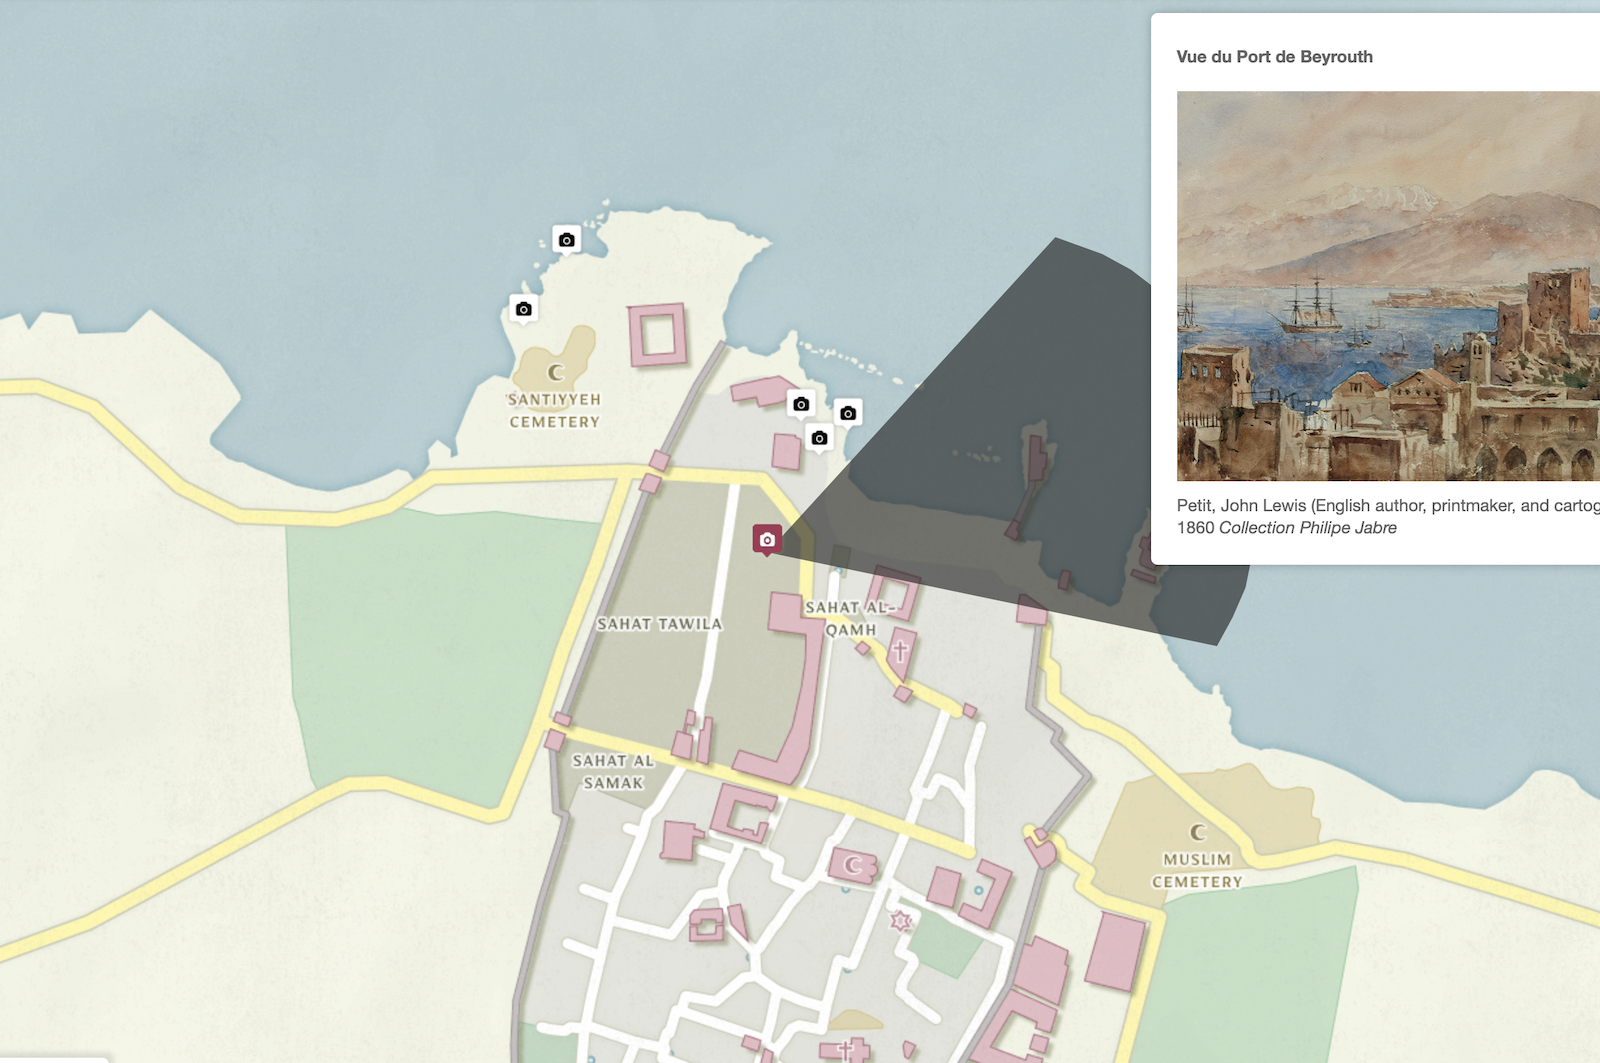
diverseLevant is an online mapping platform that illustrates the urban evolution of Beirut, over its entire history as well as across its social, cultural, and religious diversity.
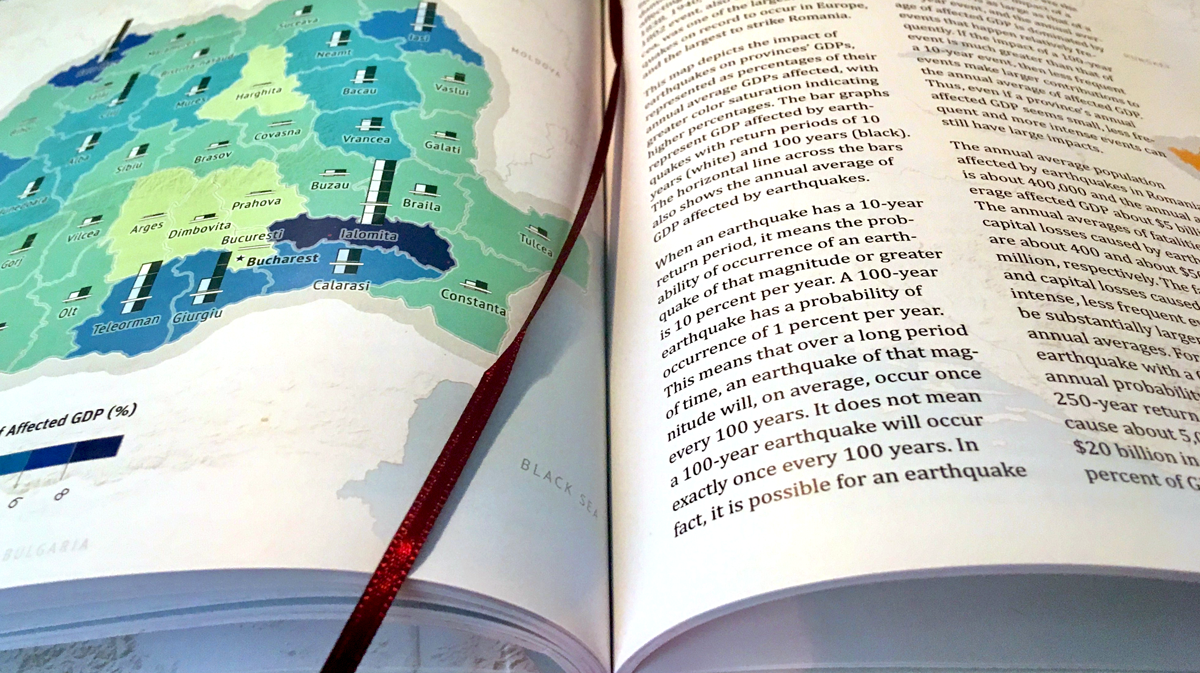
This 150-page atlas of European and Central Asian (ECA) countries was produced for the World Bank Group in coordination with the Global Facility for Disaster Reduction and Recovery (GFDRR).
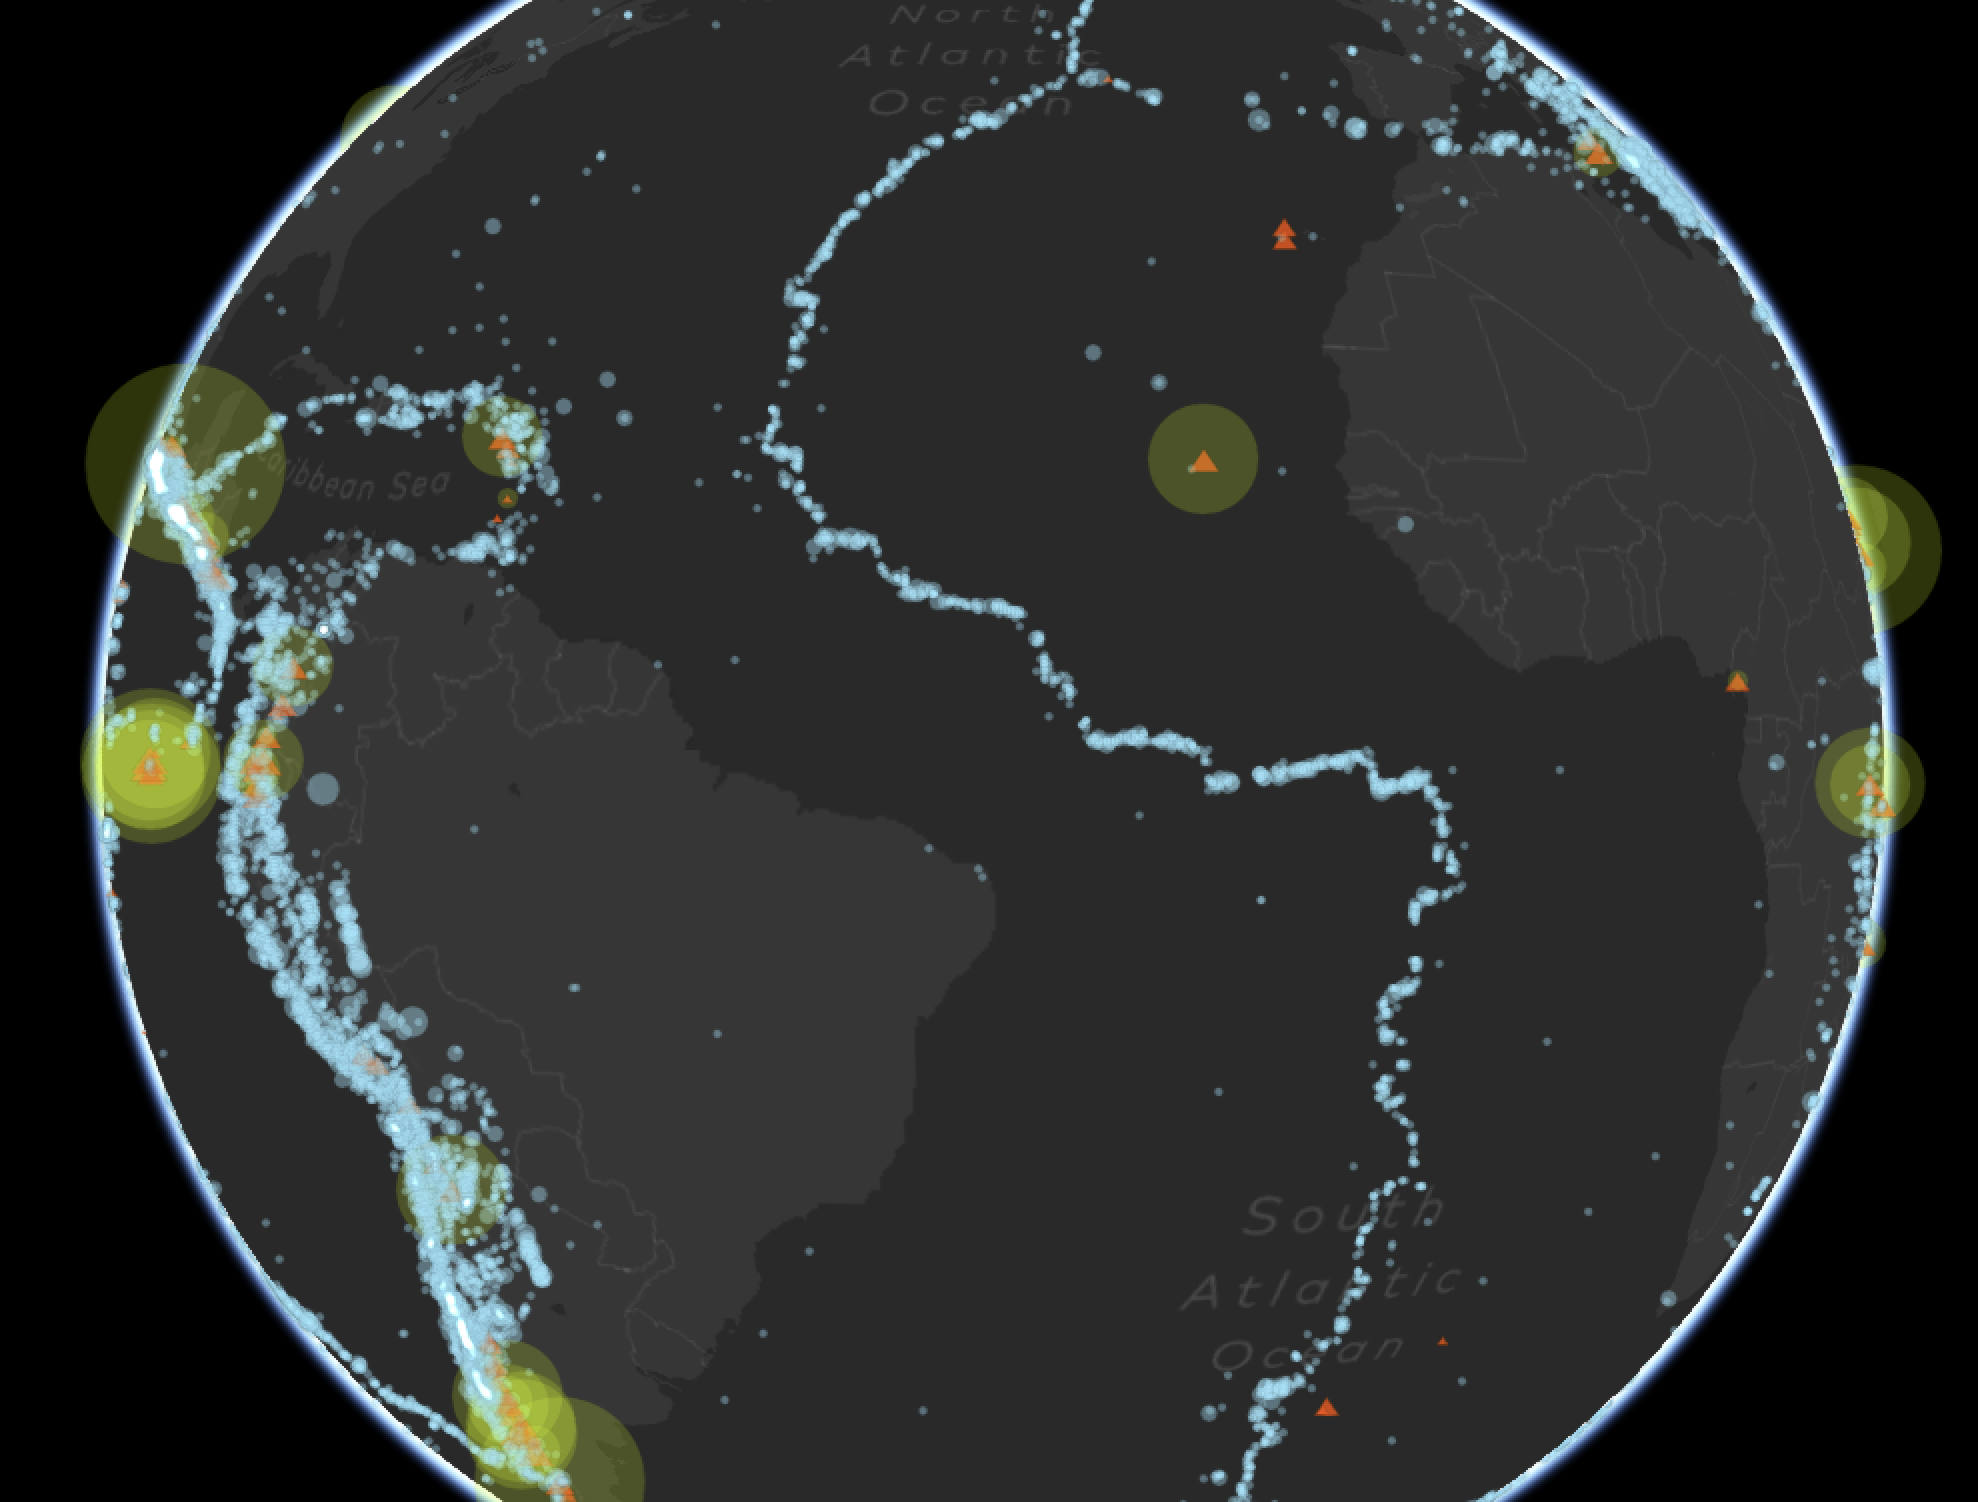
This map, built for the Smithsonian Institution's National Museum of Natural History, is a time-lapse animation of volcanic eruptions and earthquakes since 1960.
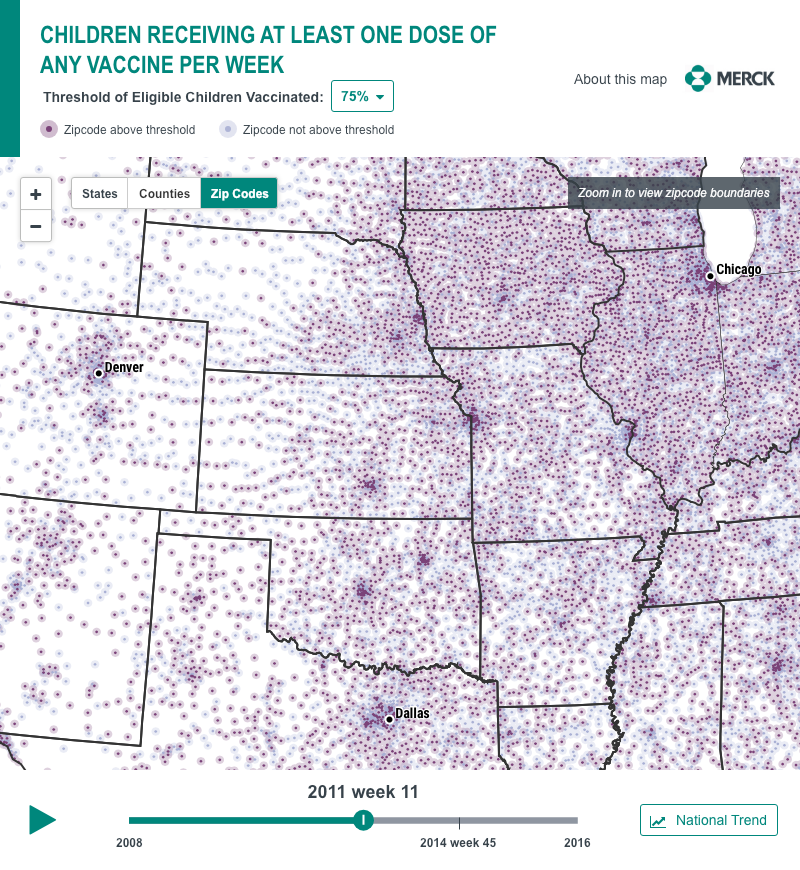
This animated map, produced for Merck, shows the uptake in vaccination for rotavirus since 2006.
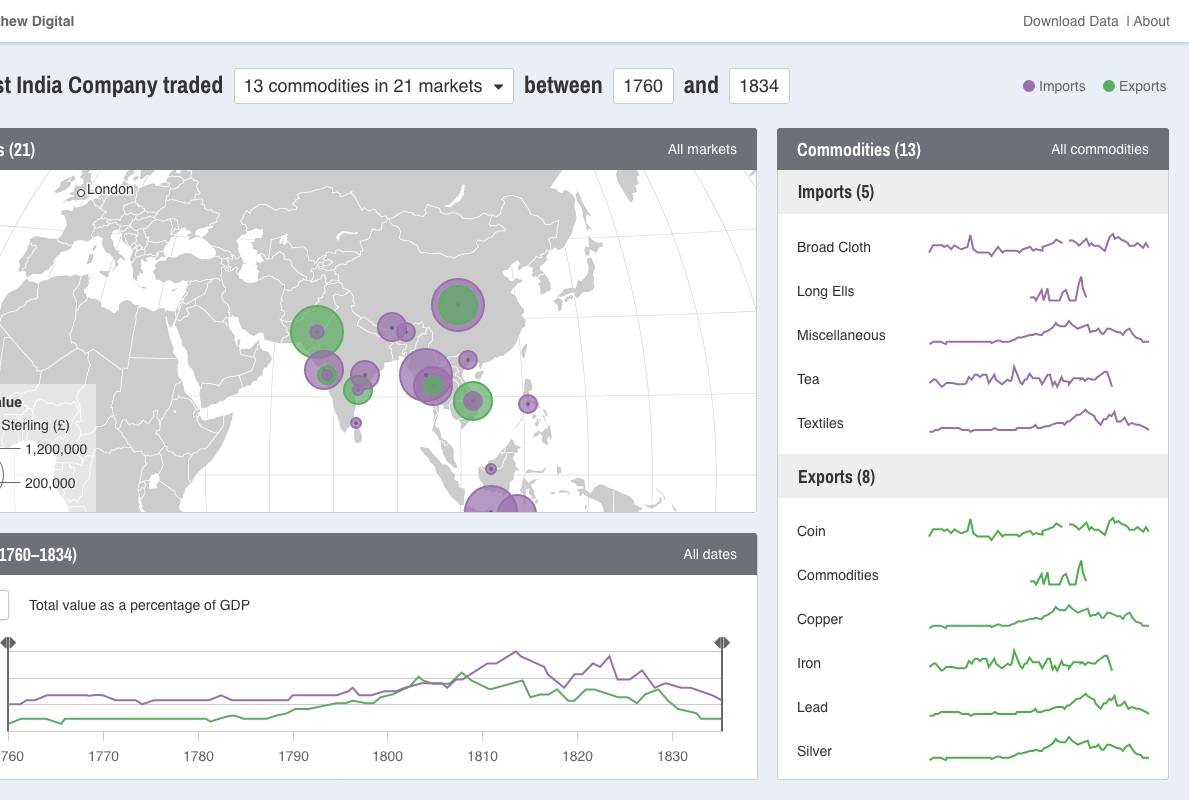
This visualization explores the company's imports and exports of 13 commodities in 17 markets between 1760 and 1834.
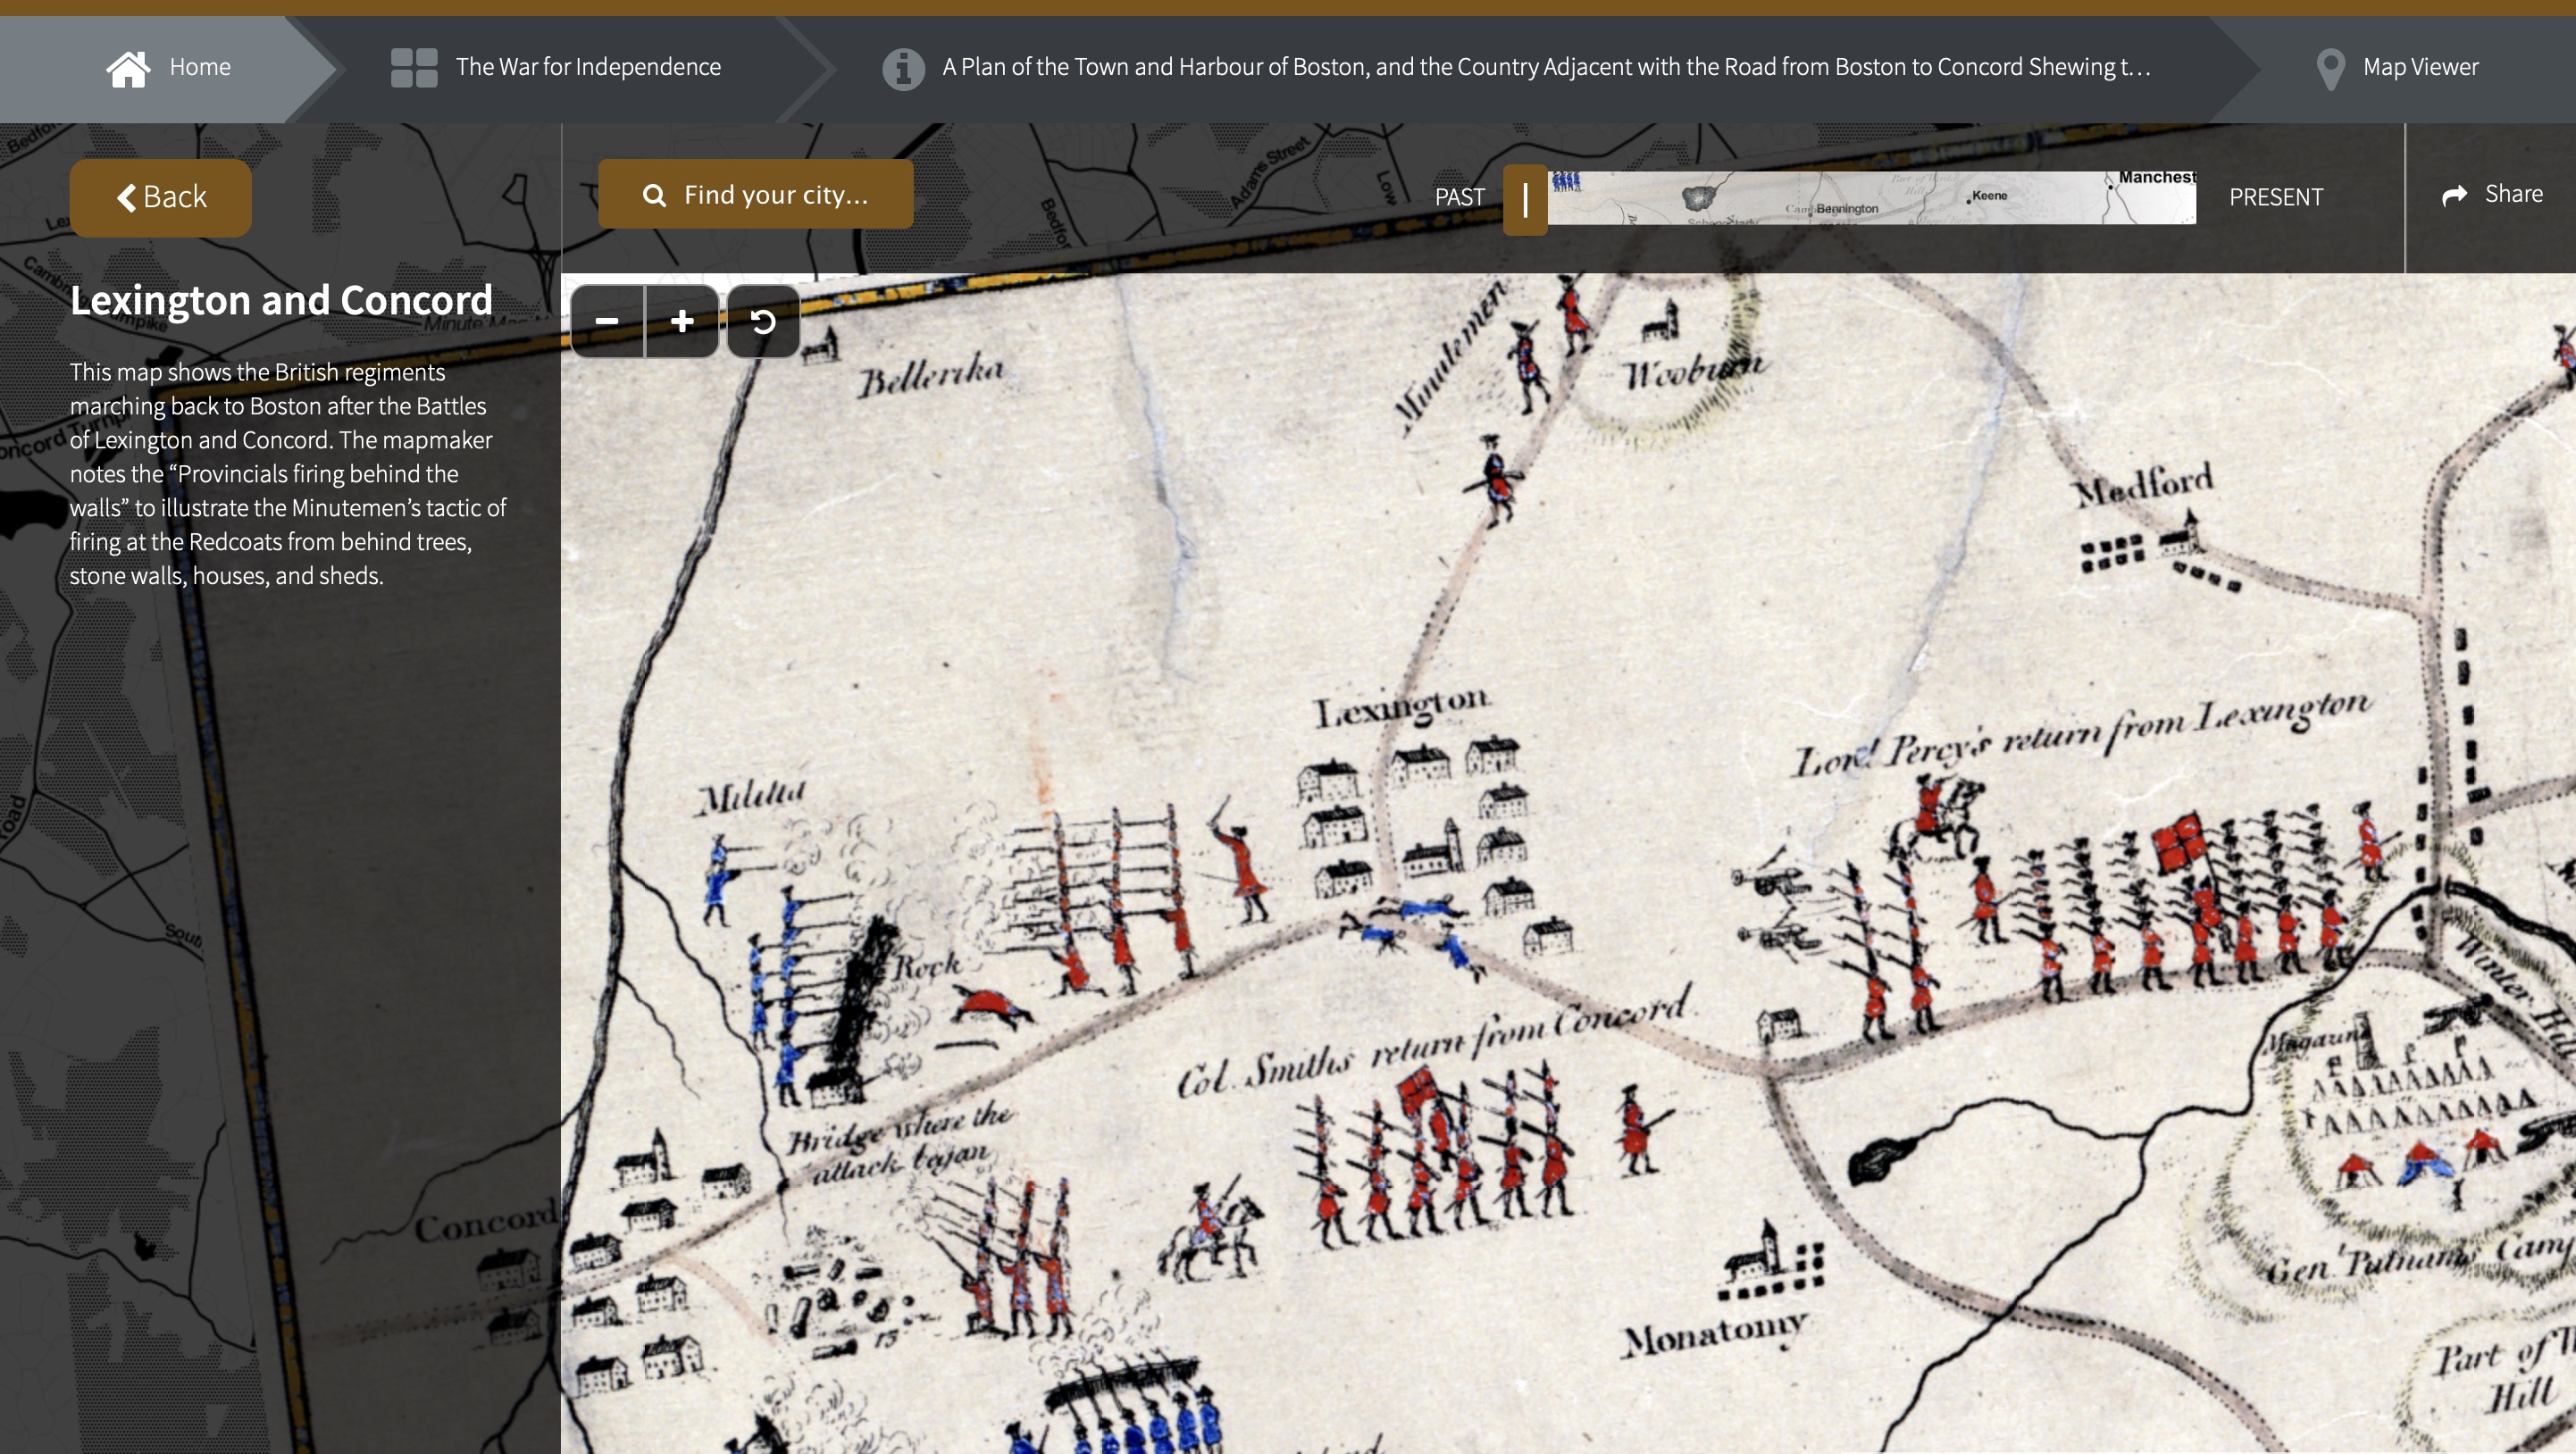
This map was designed as an interactive feature for two large touchscreens in the "We Are One" exhibition by the Normal B. Leventhal Map Center at the Boston Public Library.
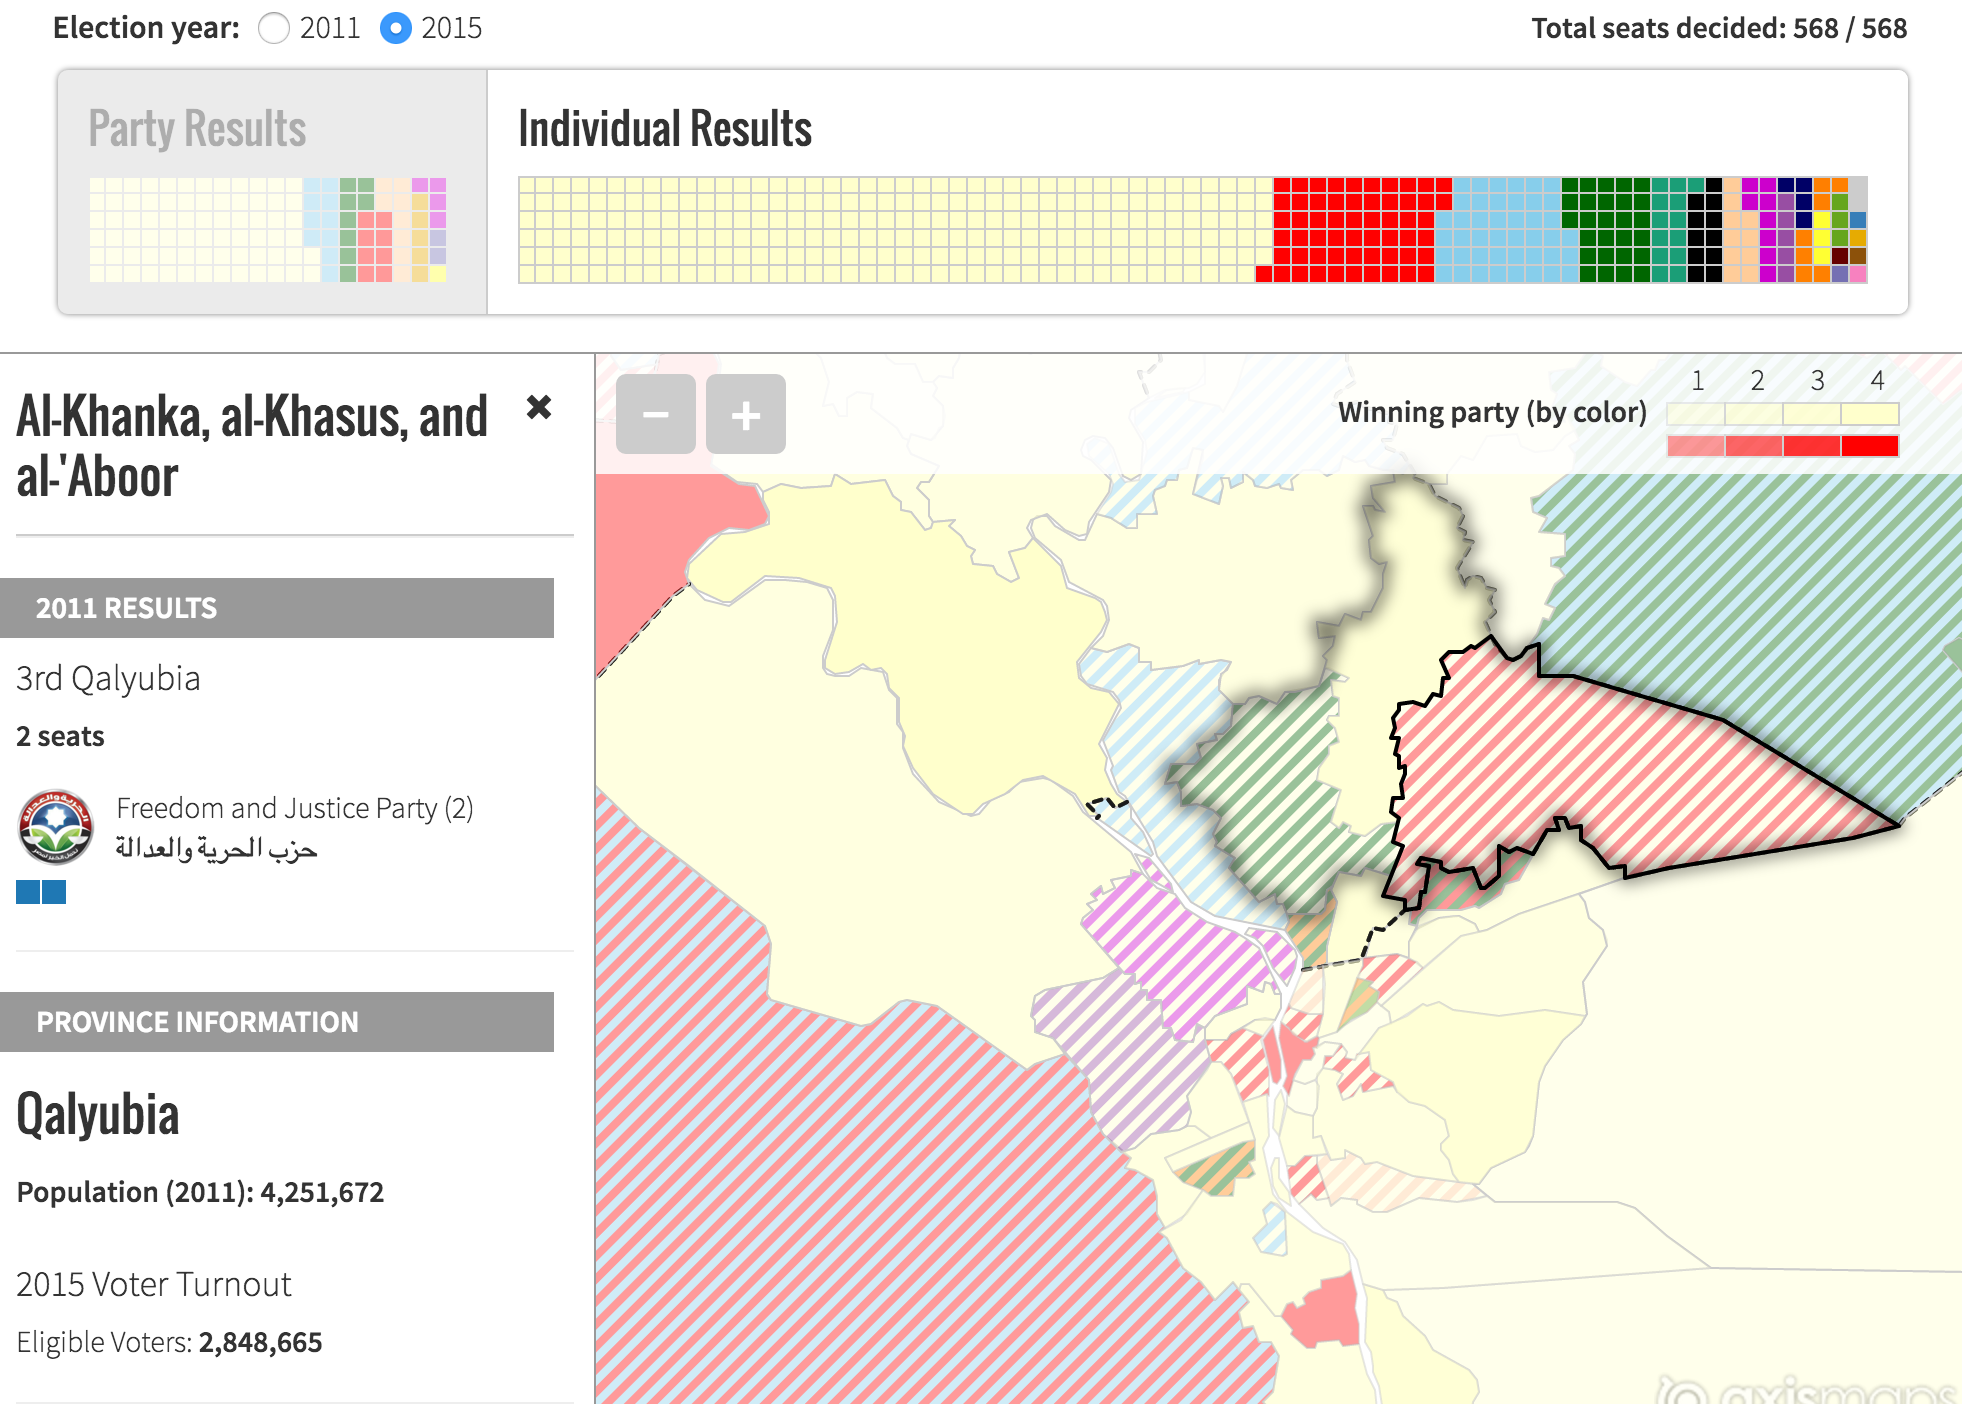
For their coverage of the 2015 Egyptian Parliamentary Elections, the Tahrir Institute for Middle Eastern Policy asked us to build a live election map to display election results as they were returned.
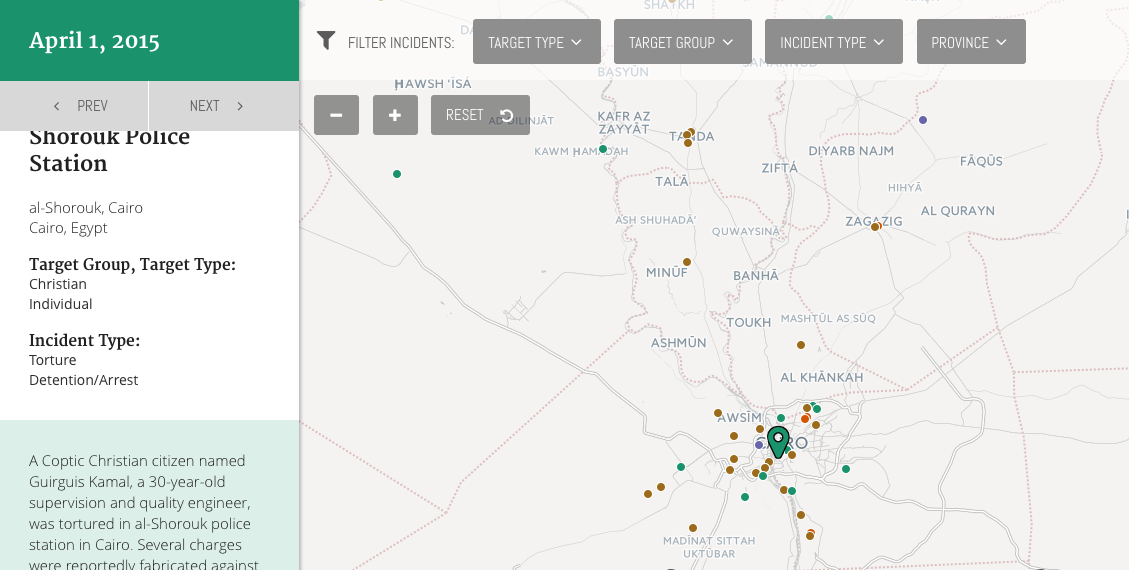
This map is the centerpiece of Eshhad, an online platform that aggregates and collates alleged religious persecution and sectarian attacks in Egypt.
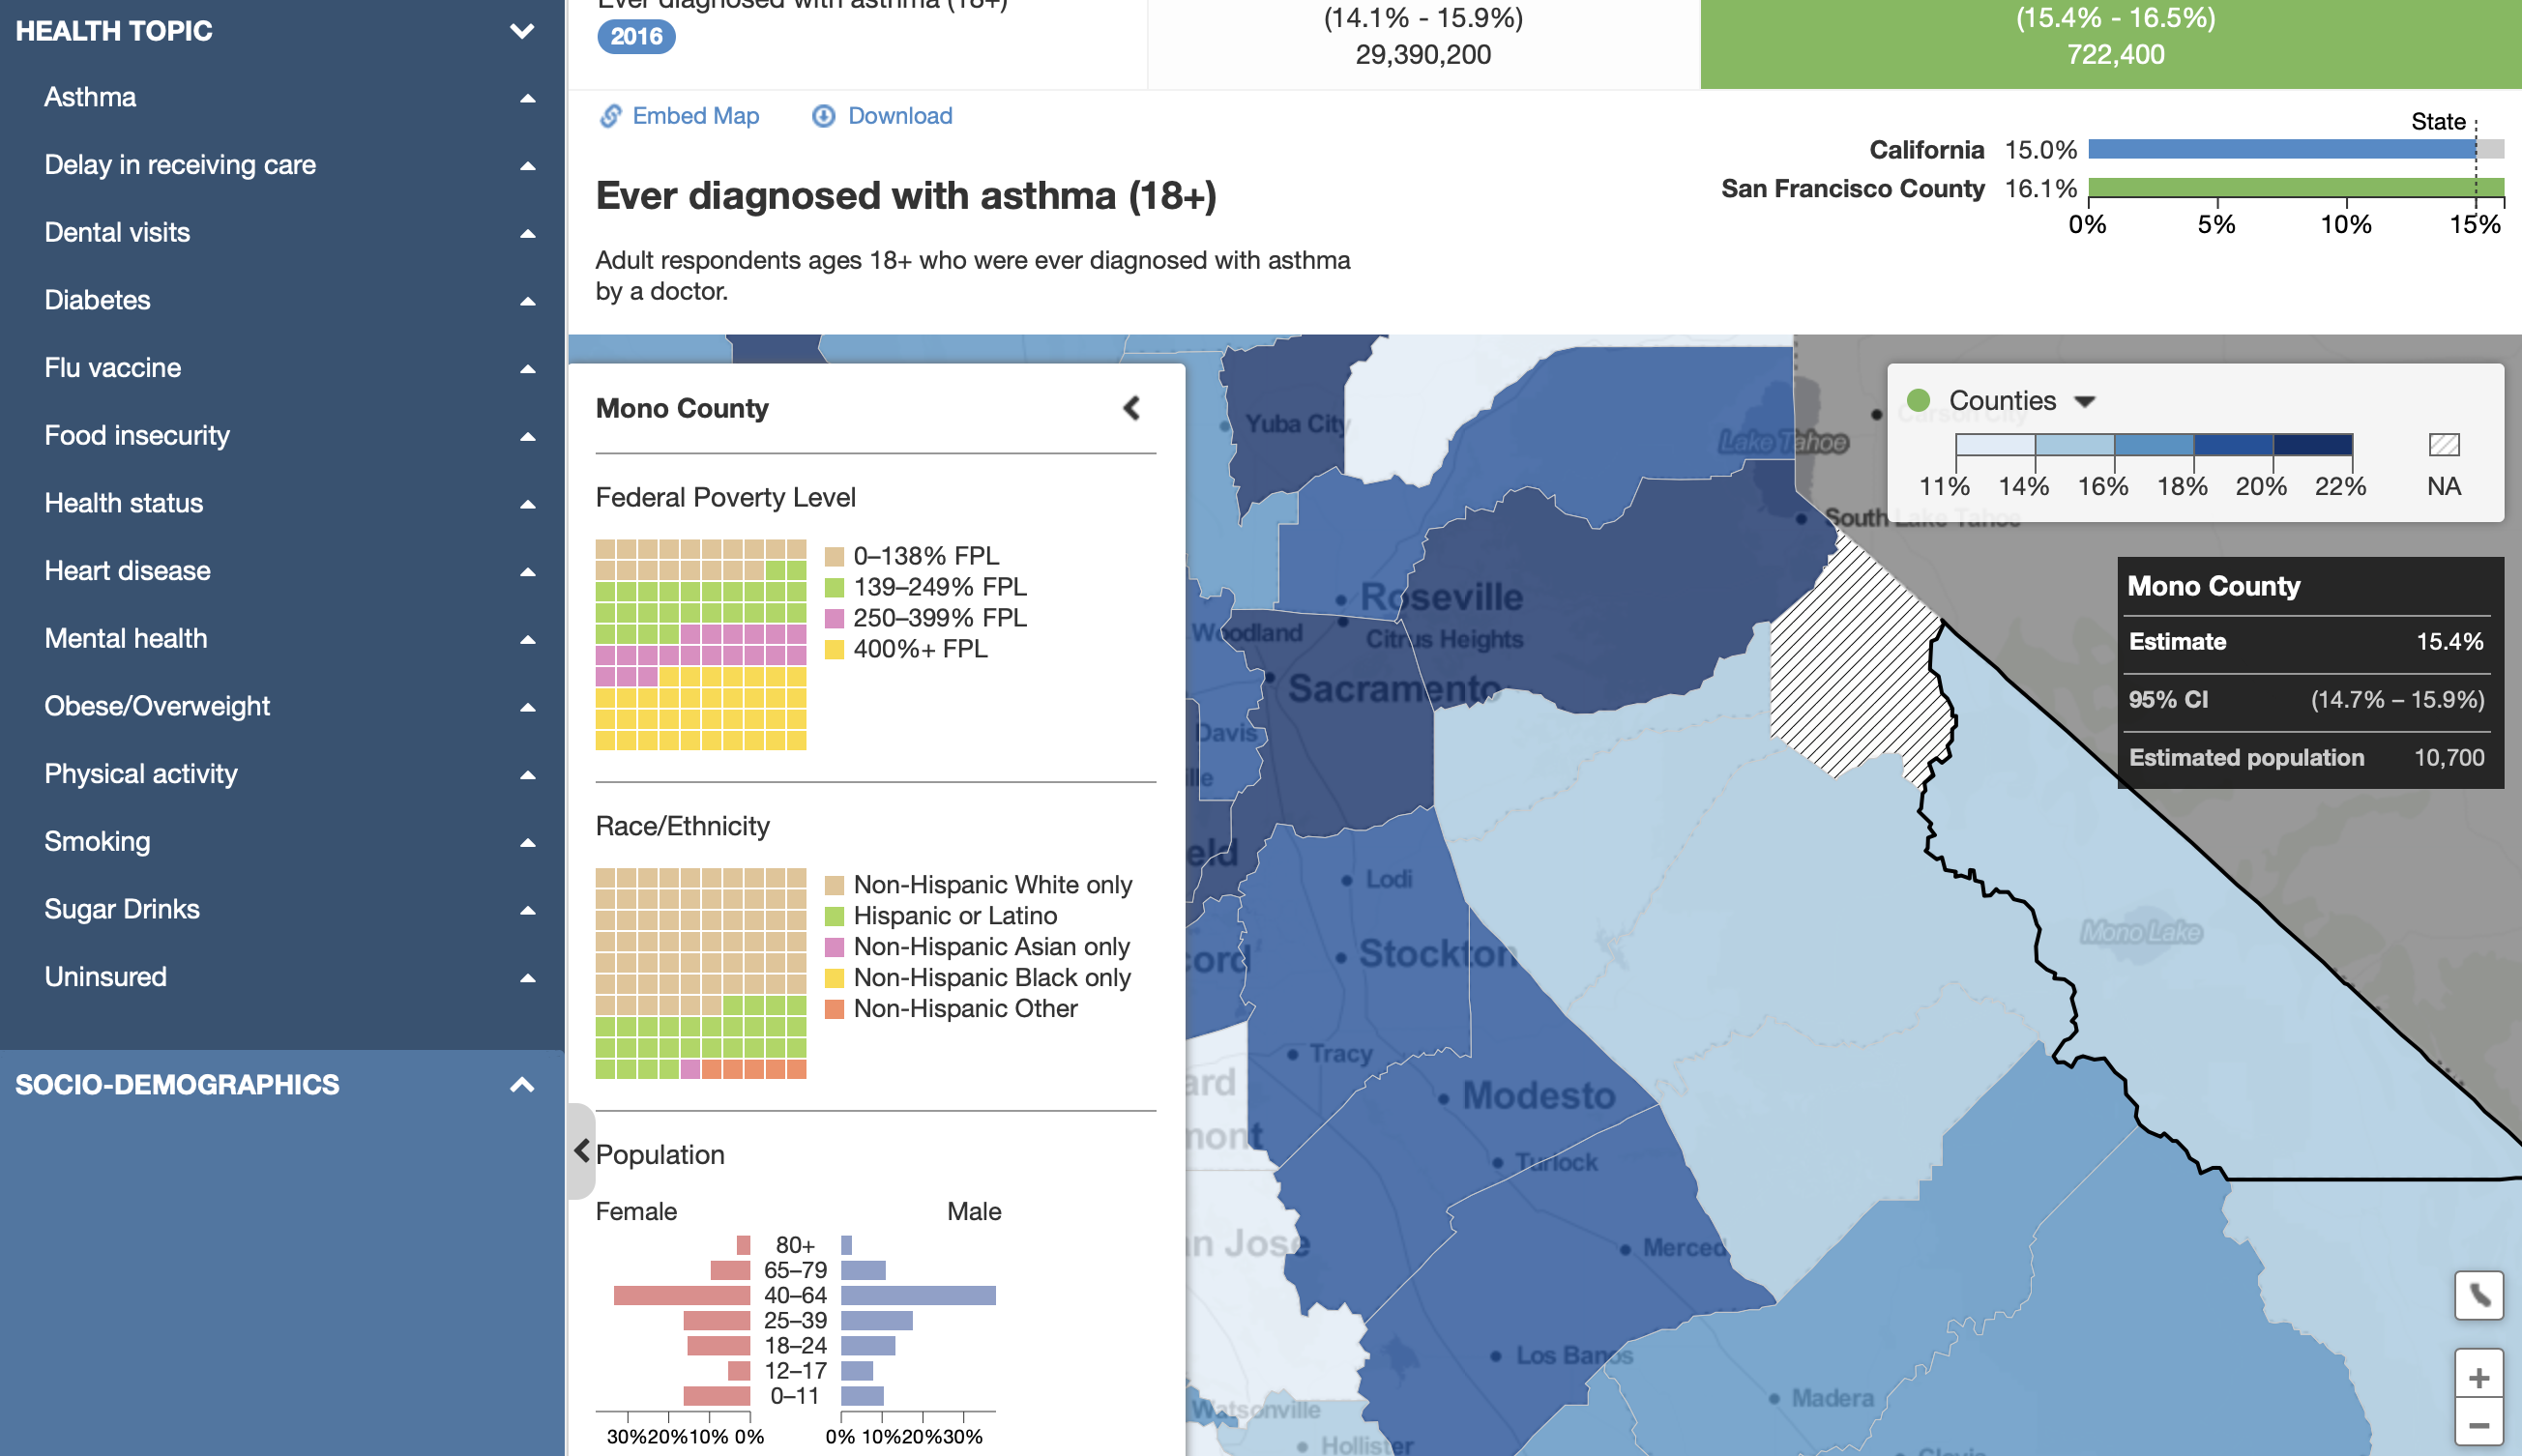
This interactive public health tool that combines map and chart components is a product of The California Health Interview Survey and the UCLA Center for Health Policy Research.
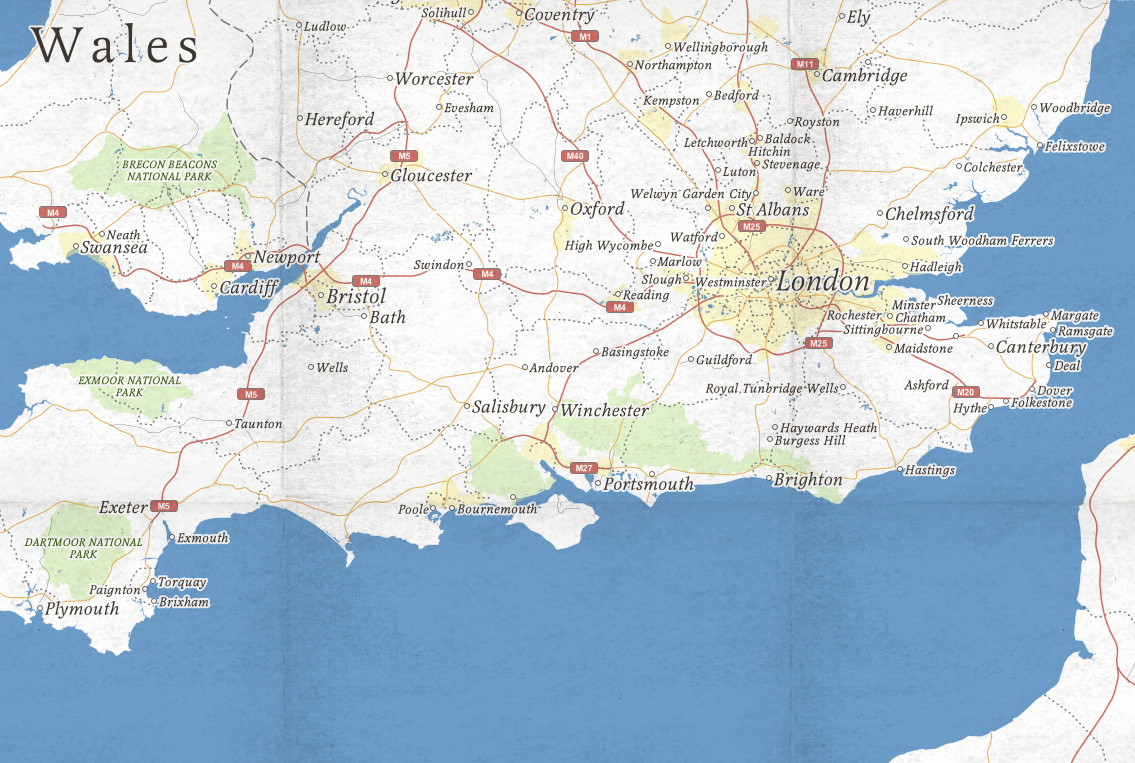
The Mass Observation project recorded everyday life in mid-century Britain.
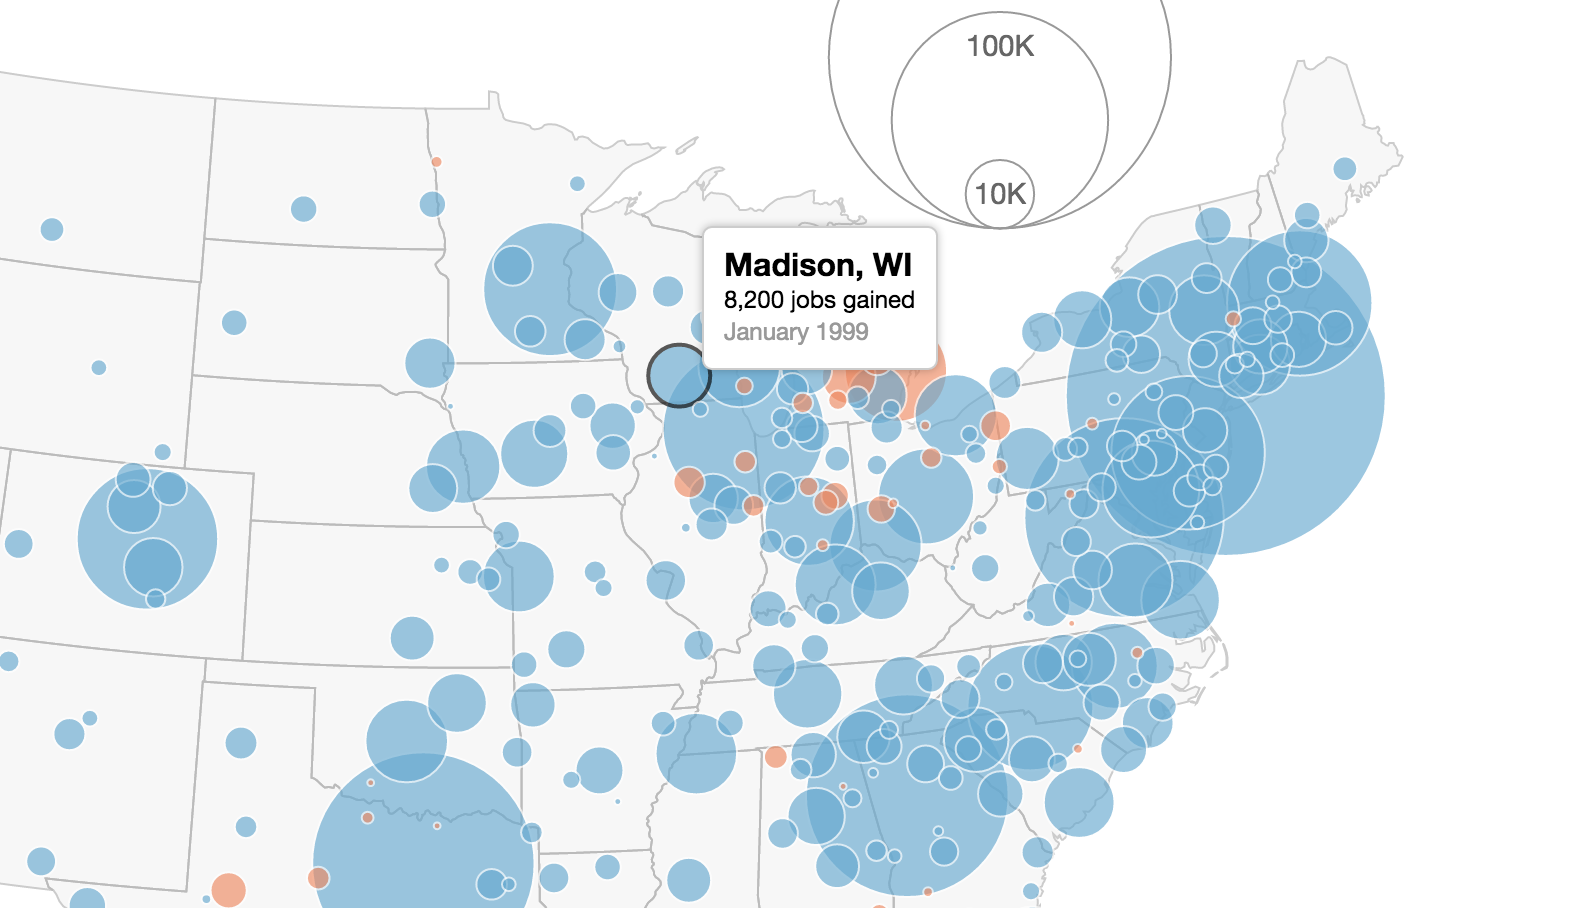
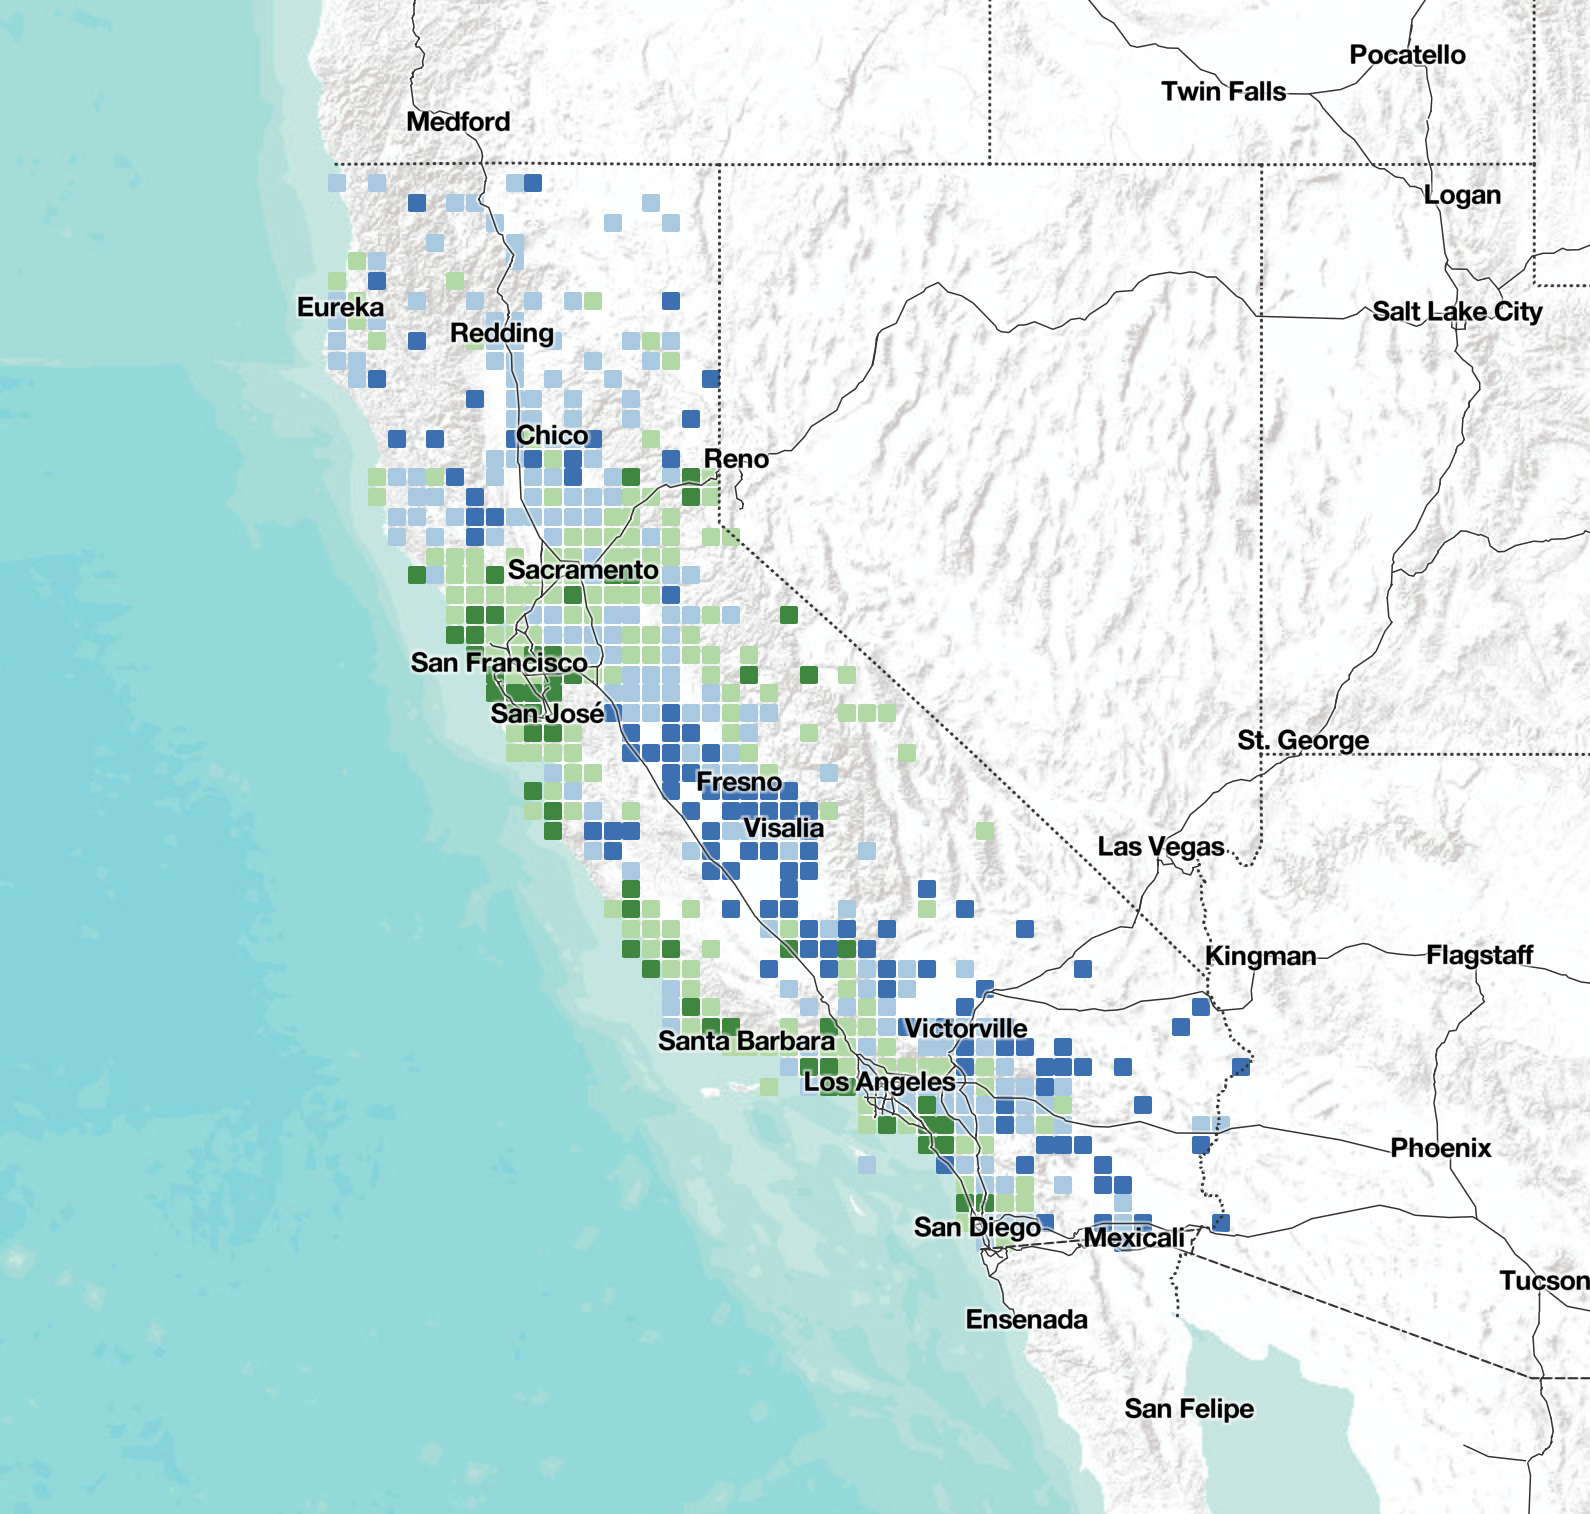
This map is a dynamic visualization of job gains and losses over the last 15+ years for every metro area in the U.S.
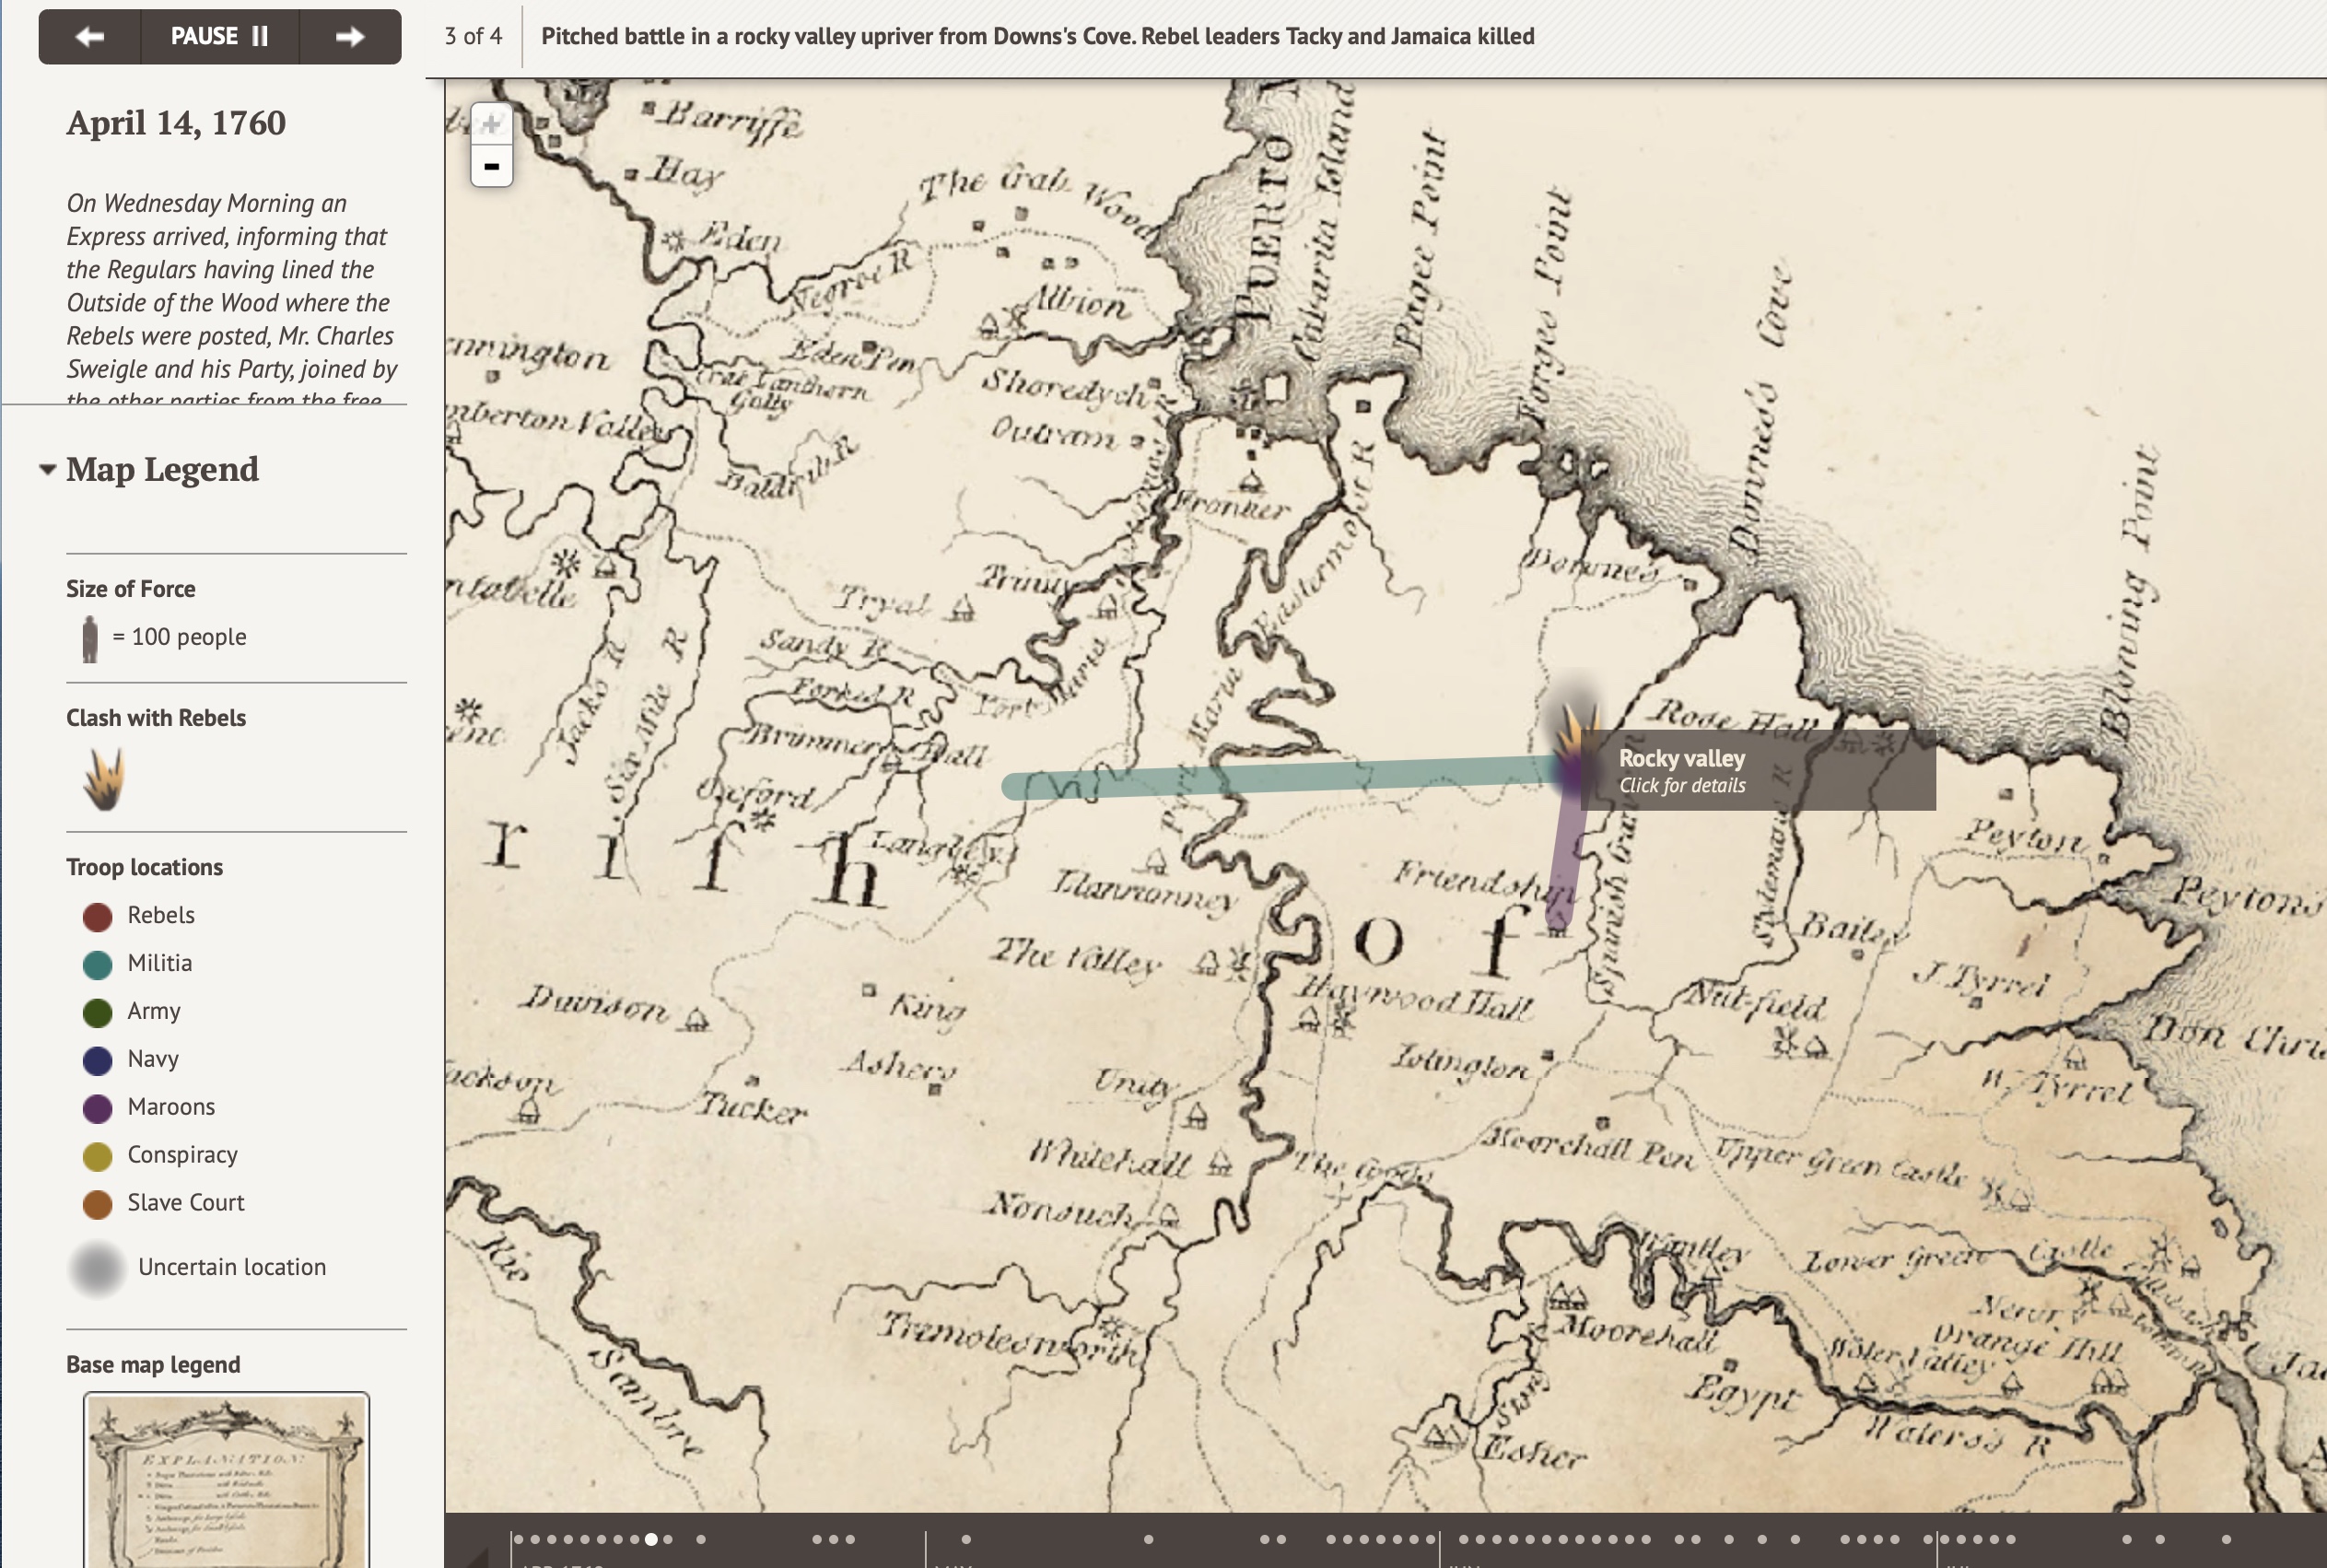
Produced for Dr. Vincent Brown’s African Rebellion Project, this map charts the events of the 1760-1761 insurrection in Jamaica.