LARC Dashboard
Visualizing disparities in Long-Acting Reversible Contraception access
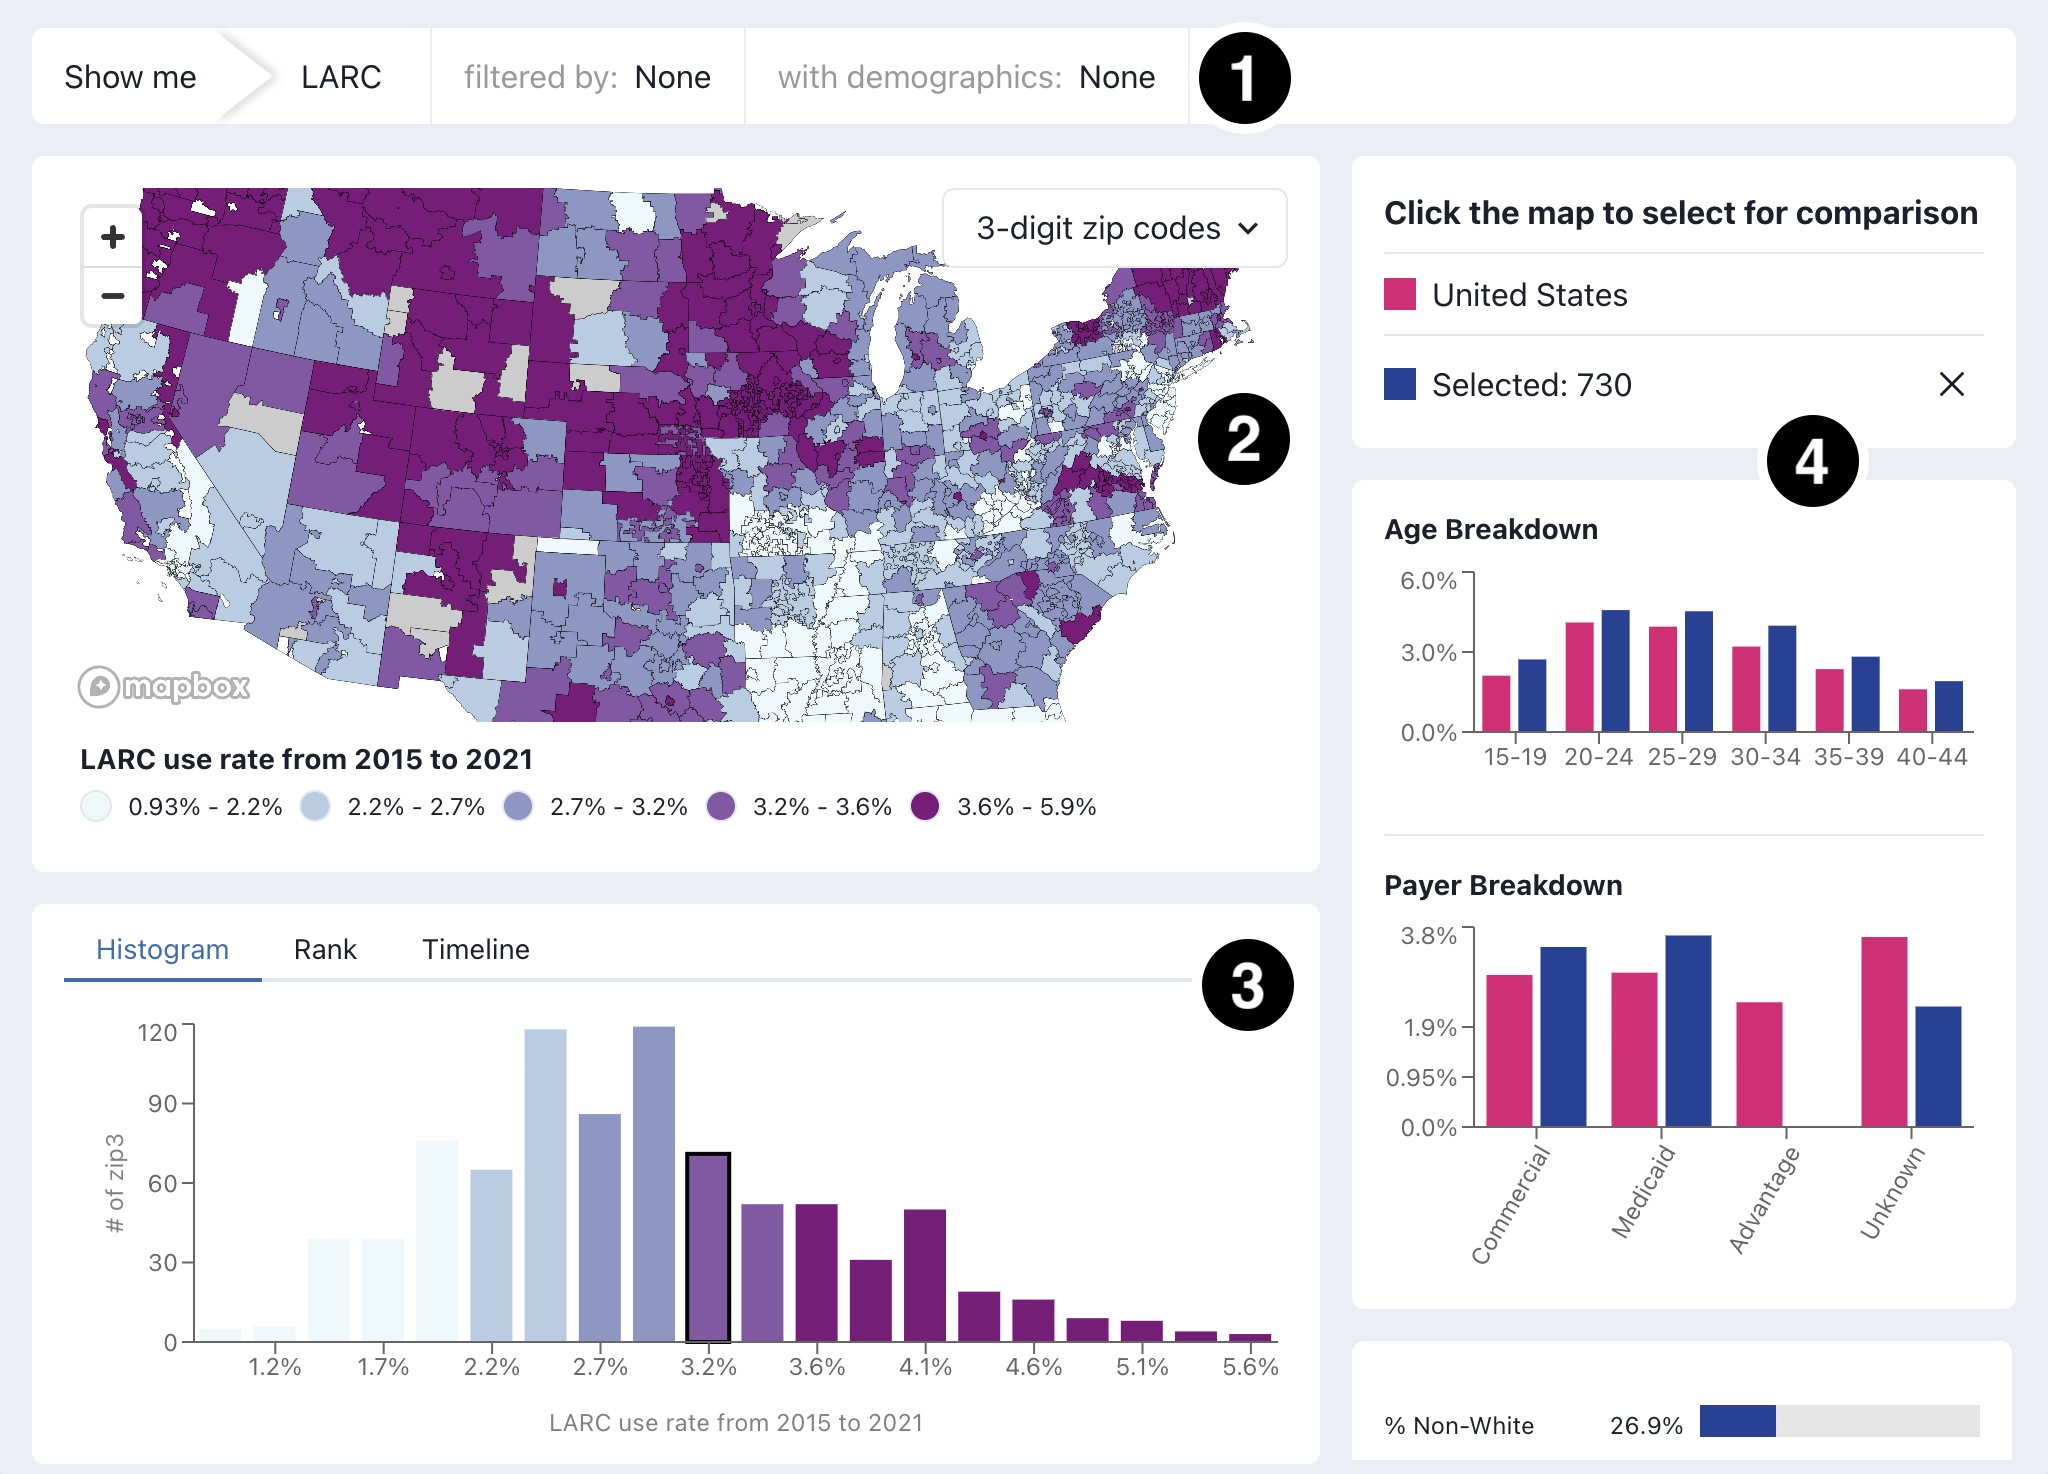
The LARC Dashboard is an interactive mapping platform that visualizes socio-demographic and geographic disparities in Long-Acting Reversible Contraception (LARC) insertion across the United States. Built for Organon, a global women's health pharmaceutical company, the tool serves as a critical resource for public health professionals, policymakers, and researchers to explore the relationship between LARC utilization and various demographic and geographic factors.
The dashboard draws from a comprehensive healthcare claims dataset representing 130 million patients—approximately 58% of the US census population—spanning from 2015 to 2021. The application visualizes LARC insertion rates (including IUDs and implants) at multiple geographic scales: 3-digit zip code (ZIP3), county, and state levels for women aged 15-44. By integrating Guttmacher Institute abortion policy classifications, the tool reveals critical insights about reproductive healthcare access, demonstrating that states with the most restrictive abortion policies have consistently lower mean LARC insertion rates (2.98% on average) compared to states with protective policies.
The interface is organized into four interconnected components that allow for comprehensive data exploration. The main choropleth map displays insertion rates with interactive tooltips providing detailed statistics for each geographic unit. Above the map, filter controls enable users to select specific years, states, and demographic parameters. Below the map, linked histogram and ranked bar chart visualizations provide alternative views of the data distribution, with mouseover interactions highlighting corresponding geographic areas. A timeline slider allows users to explore temporal trends and identify patterns over the study period. The right panel displays detailed breakdowns by payer type (commercial, Medicaid, Medicare Advantage) and demographic characteristics for selected geographic units, enabling comparative analysis across multiple regions.
Built using React and Mapbox GL JS for fluid vector tile rendering, the application handles the complexity of multi-scale geographic data with responsive performance. Python scripts process the raw claims data, performing secure aggregation and anonymization while maintaining statistical validity. The backend employs PostGIS for efficient spatial queries and data aggregation, with results cached to a CDN to ensure rapid load times even with large datasets. Given the sensitive nature of reproductive health data, the platform implements robust privacy protections, ensuring all patient information is properly de-identified and aggregated at appropriate geographic levels. The interface provides clear data visibility while maintaining professional presentation suitable for both research and policy contexts.
The LARC Dashboard has become an essential tool for understanding and addressing disparities in reproductive healthcare access. The visualization powerfully illustrates how geographic location and state policy environments create additional barriers to accessing the most effective forms of contraception, with some states showing LARC insertion rates consistently in the lowest quartile across nearly all ZIP3 areas. Healthcare organizations use the tool to identify underserved regions and plan targeted interventions, while researchers leverage the temporal data to analyze the impact of policy changes on contraceptive access. By making complex healthcare utilization patterns visible and accessible, the dashboard supports evidence-based advocacy and strategic planning to improve reproductive health equity across the United States.