Atlas of Rotavirus Prevalence
Visualizing vaccine effectiveness through real-world data
The Atlas of Rotavirus Prevalence is a comprehensive web-based platform that demonstrates novel methods to visualize and monitor the introduction and effectiveness of vaccines using real-world data. Built for Merck, this digital atlas extends beyond our previous animated rotavirus map by providing multiple interactive visualizations that reveal the dramatic impact of rotavirus vaccination on pediatric health outcomes across the United States from 1996 to 2017.
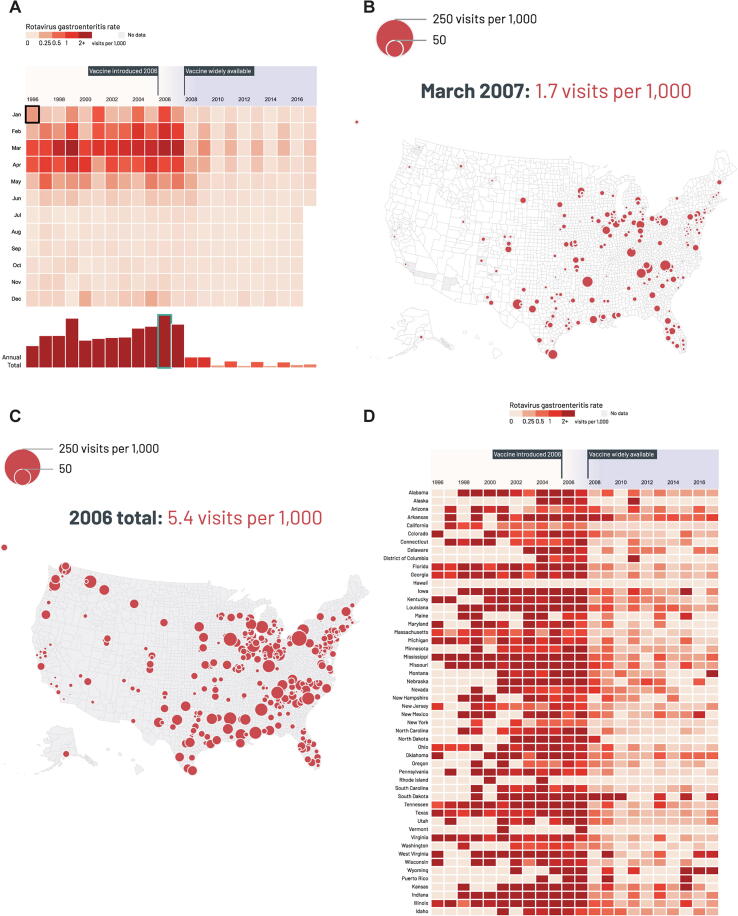
The platform combines observational data from a large US national insurance claims database spanning over 20 years, encompassing over 17 million zip code-weeks of data. Unlike the earlier project which focused primarily on animated vaccination uptake, this atlas provides a suite of complementary visualizations that allow public health officials to explore the relationship between vaccine introduction and disease reduction from multiple perspectives. The visualizations show how rotavirus-related medical encounters peaked seasonally from November to February before vaccine availability in 2006, then dramatically declined as vaccination coverage rapidly increased after 2010.
The atlas features seven distinct visualization types, each revealing different aspects of the vaccination story. Time-based heatmaps organize data by year and month in a gridded format, making the seasonal disease patterns and post-vaccine decline immediately apparent. Location-based gridded heatmaps arrange states in a non-geographic grid to show how disease rates changed over time across the country. Animated line graphs display the inverse relationship between vaccination uptake and medical encounters at national, state, and county levels. Interactive cartograms provide equal visual weight to all states regardless of size, while proportional symbol maps show disease rates at the county level with detailed data probes revealing trends over time.
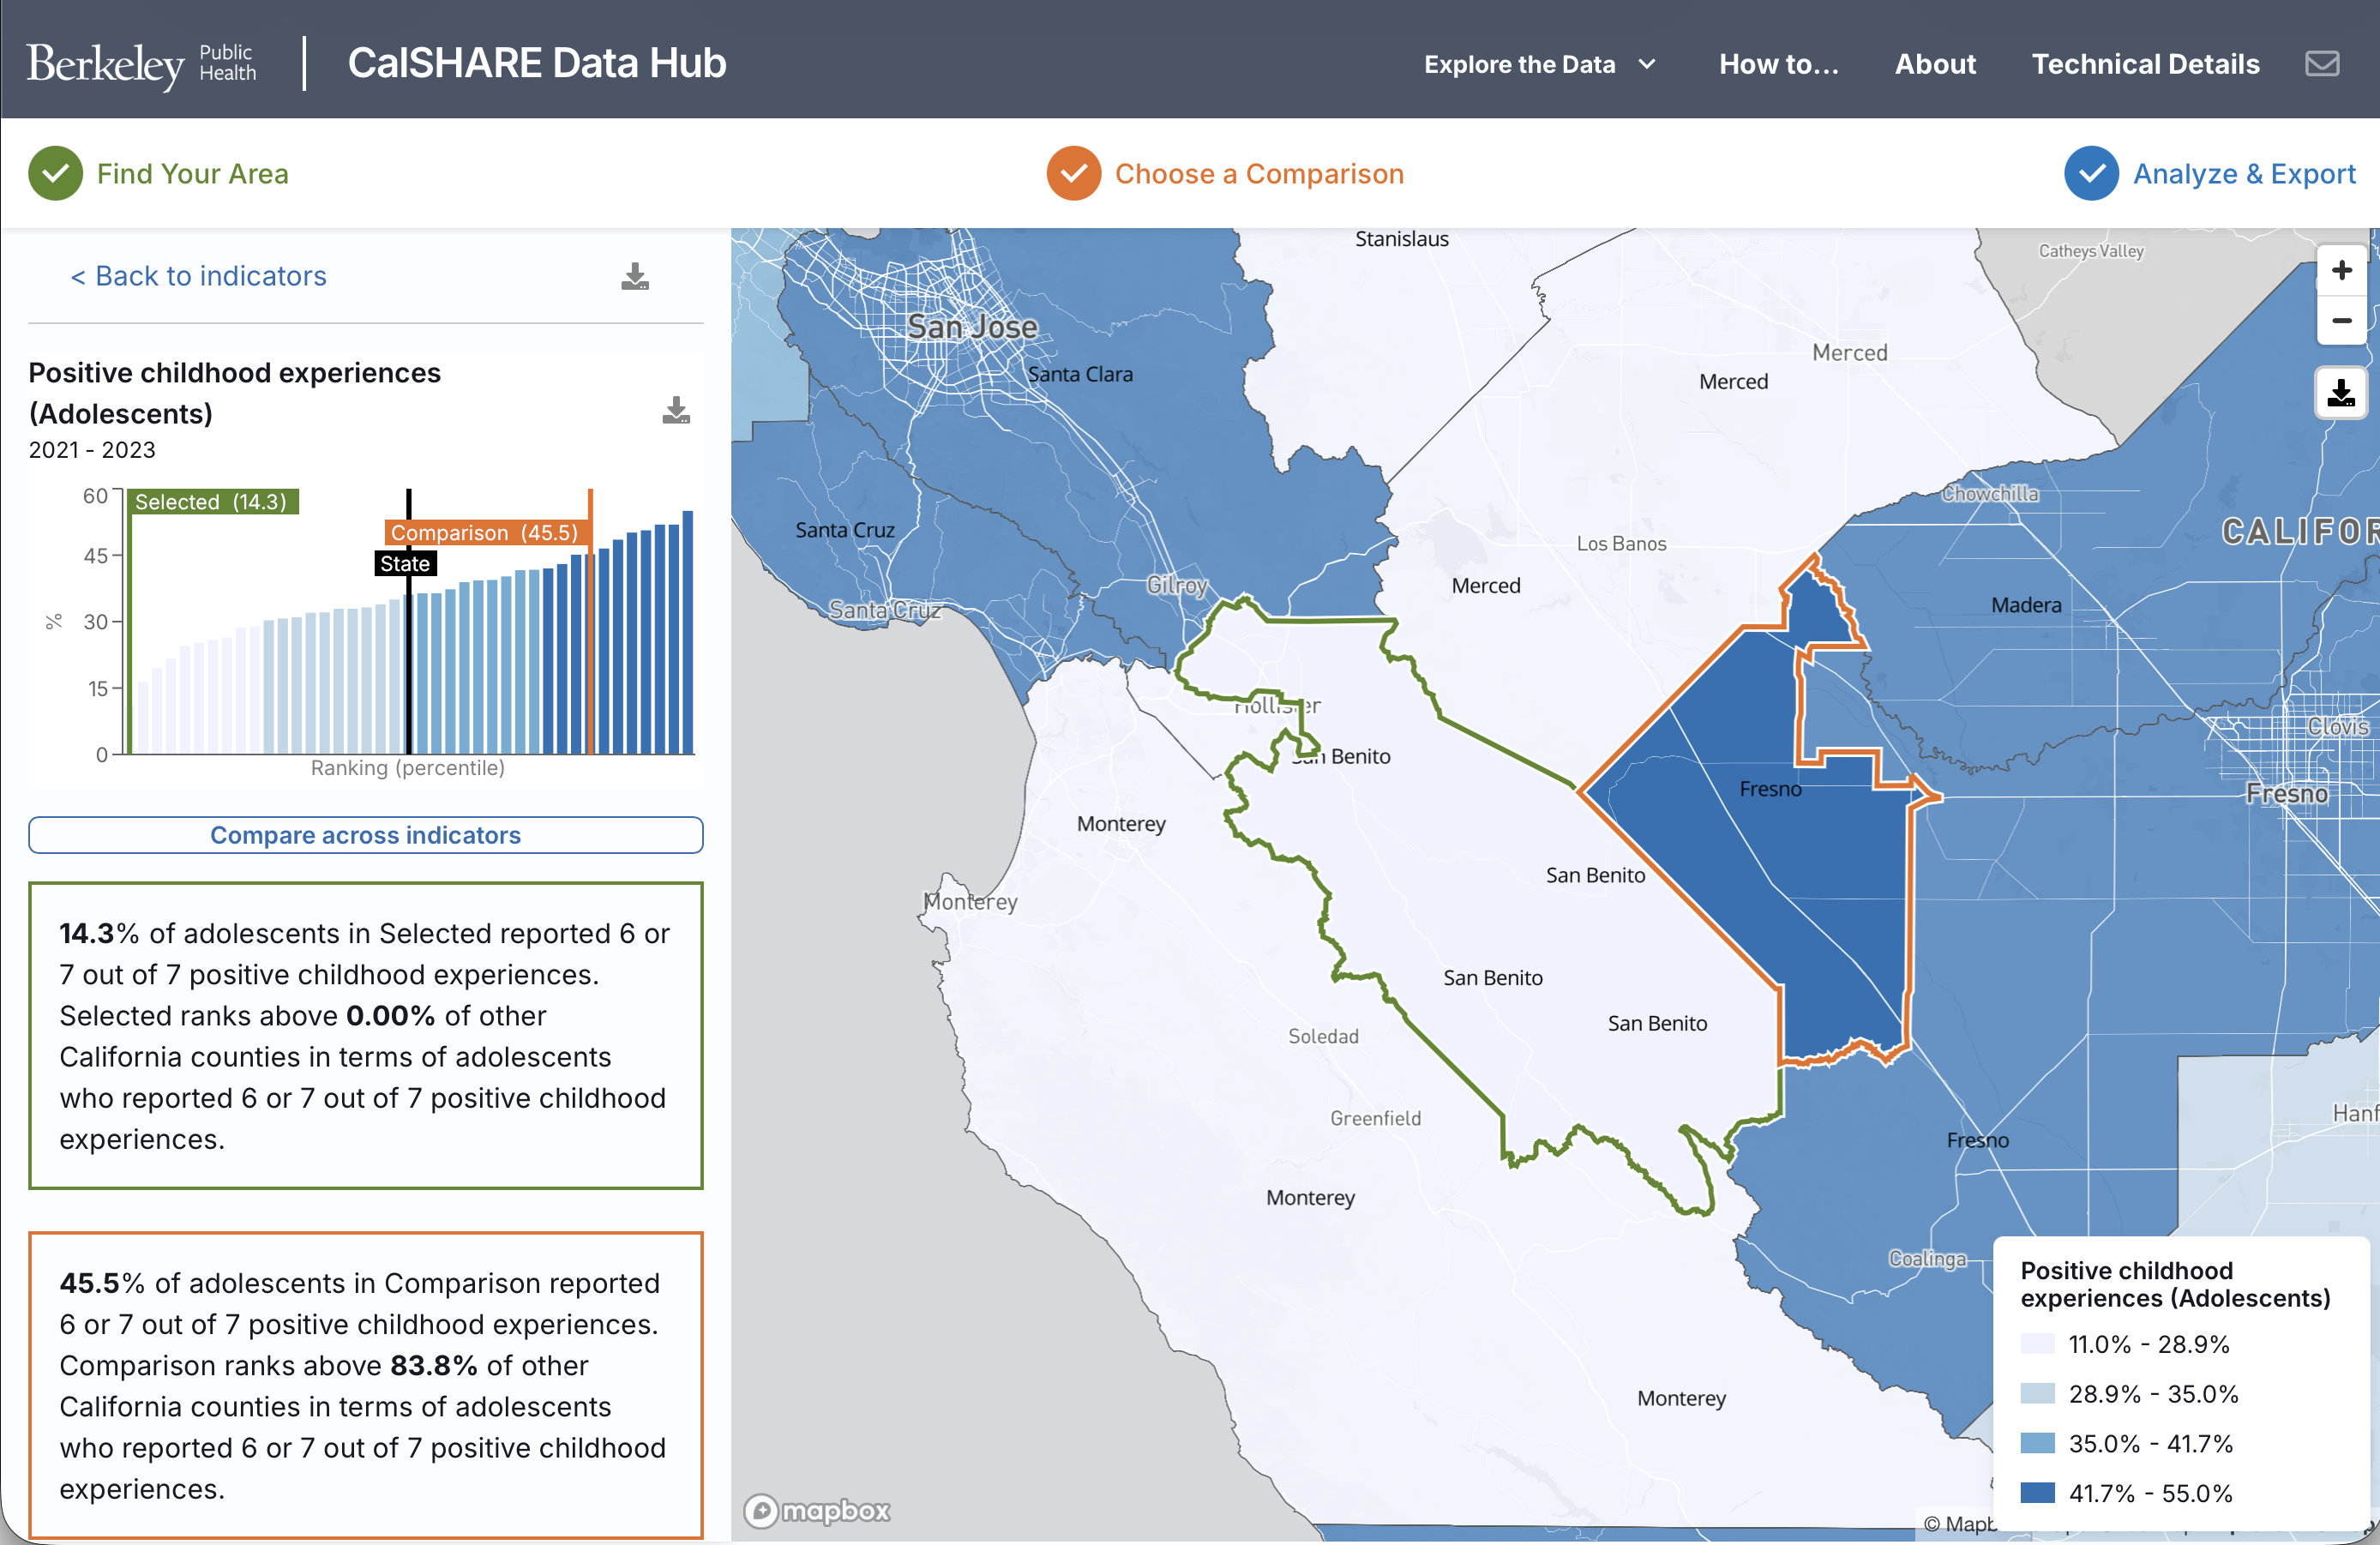
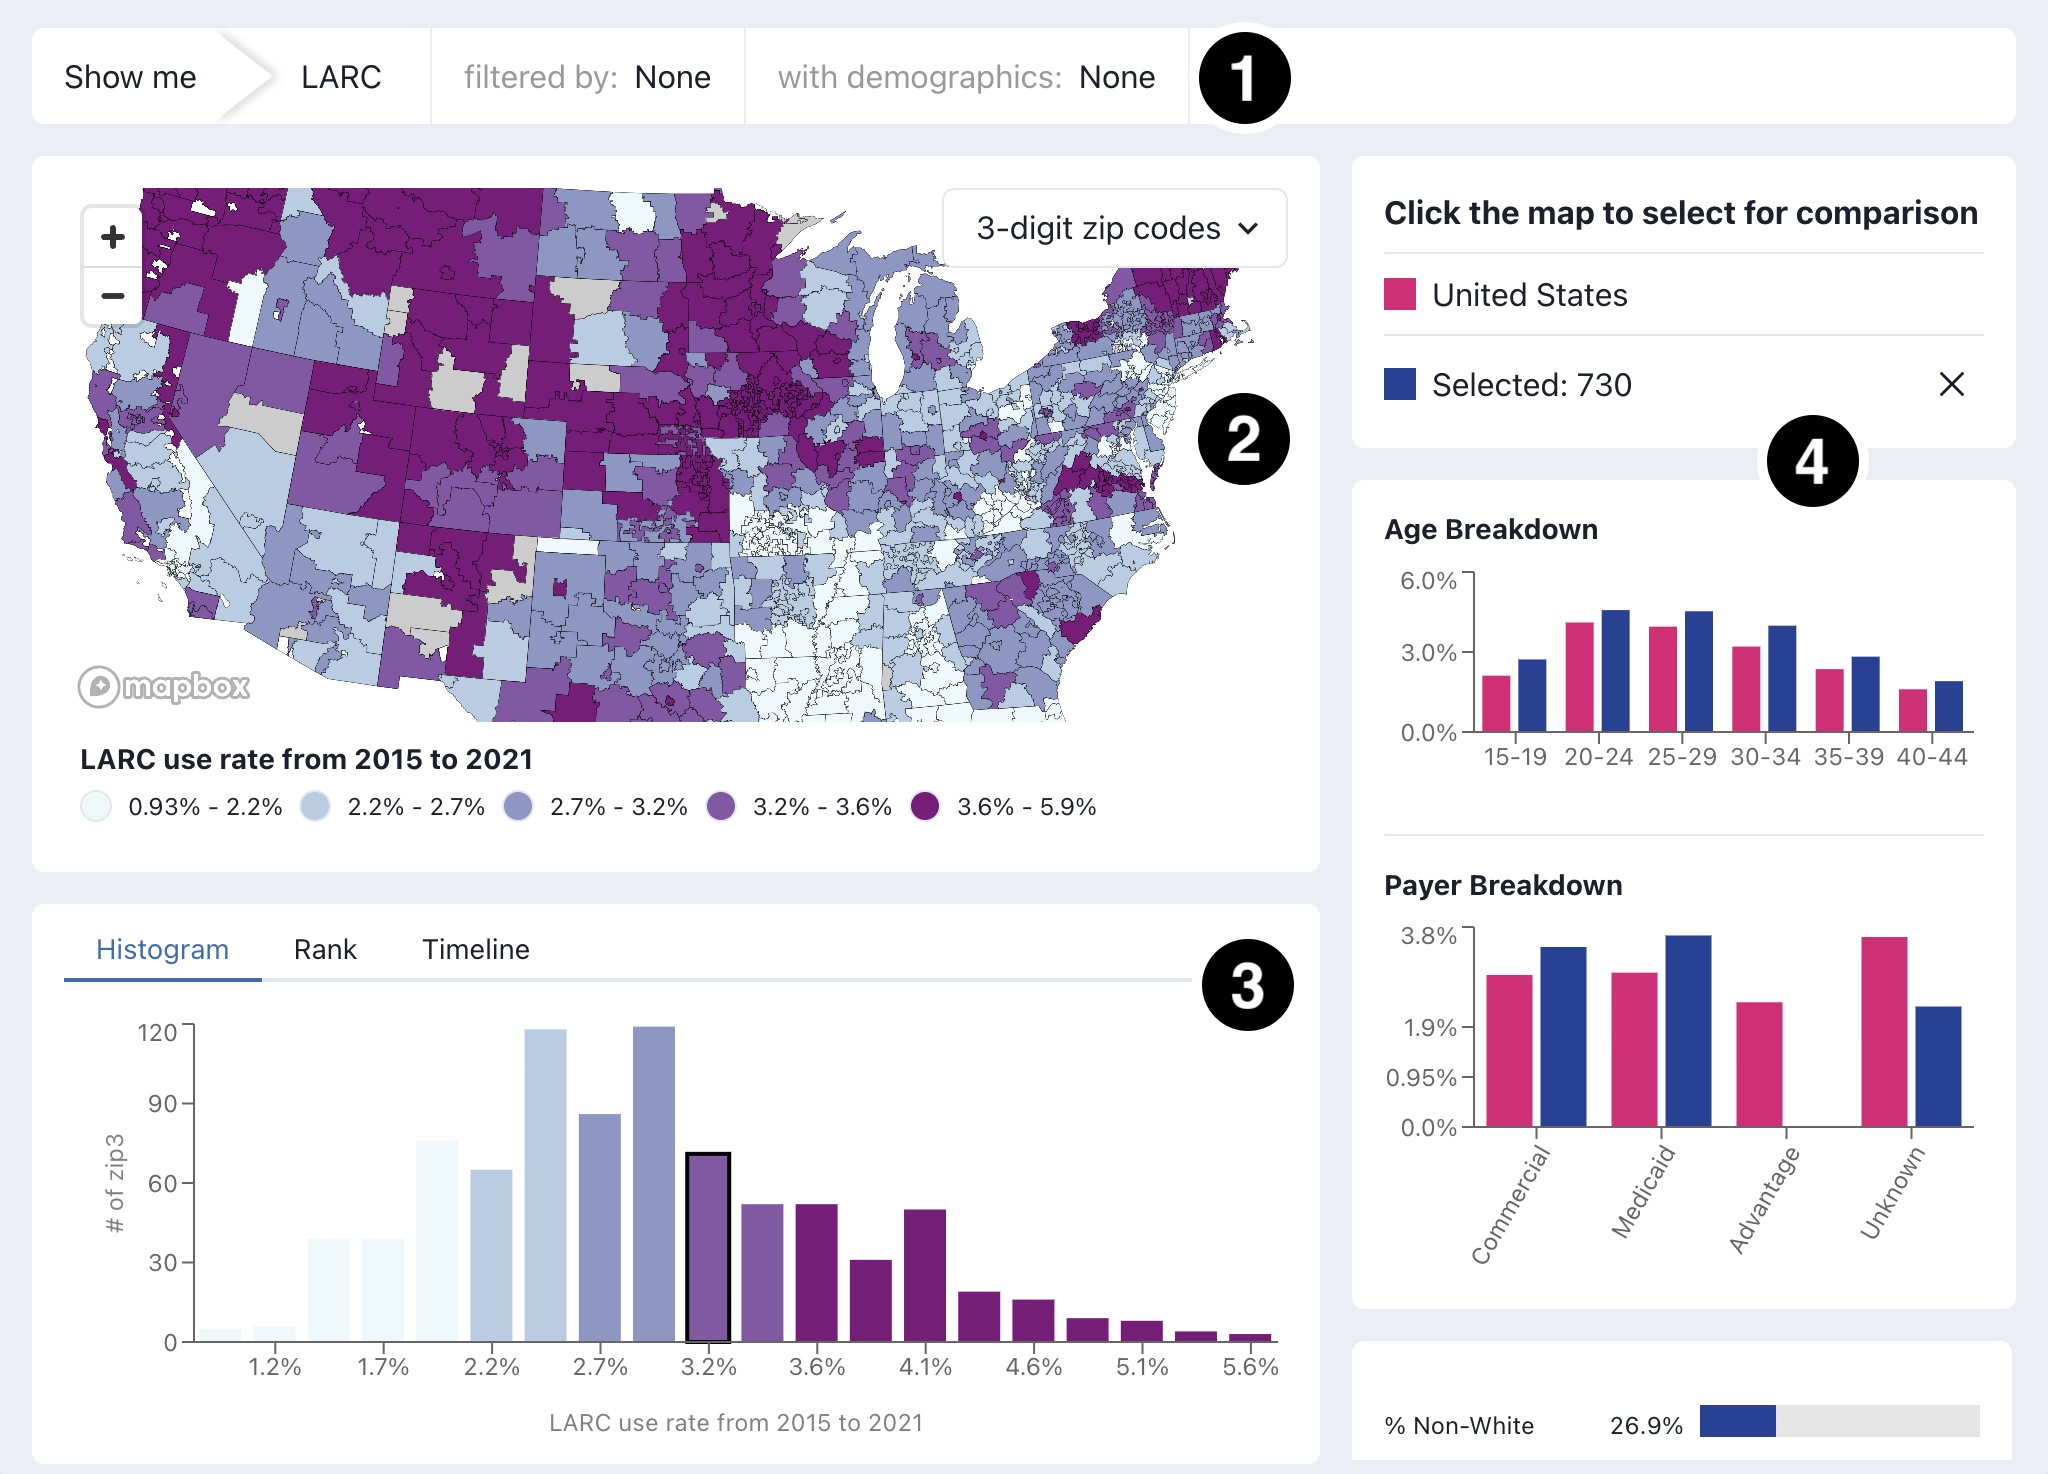
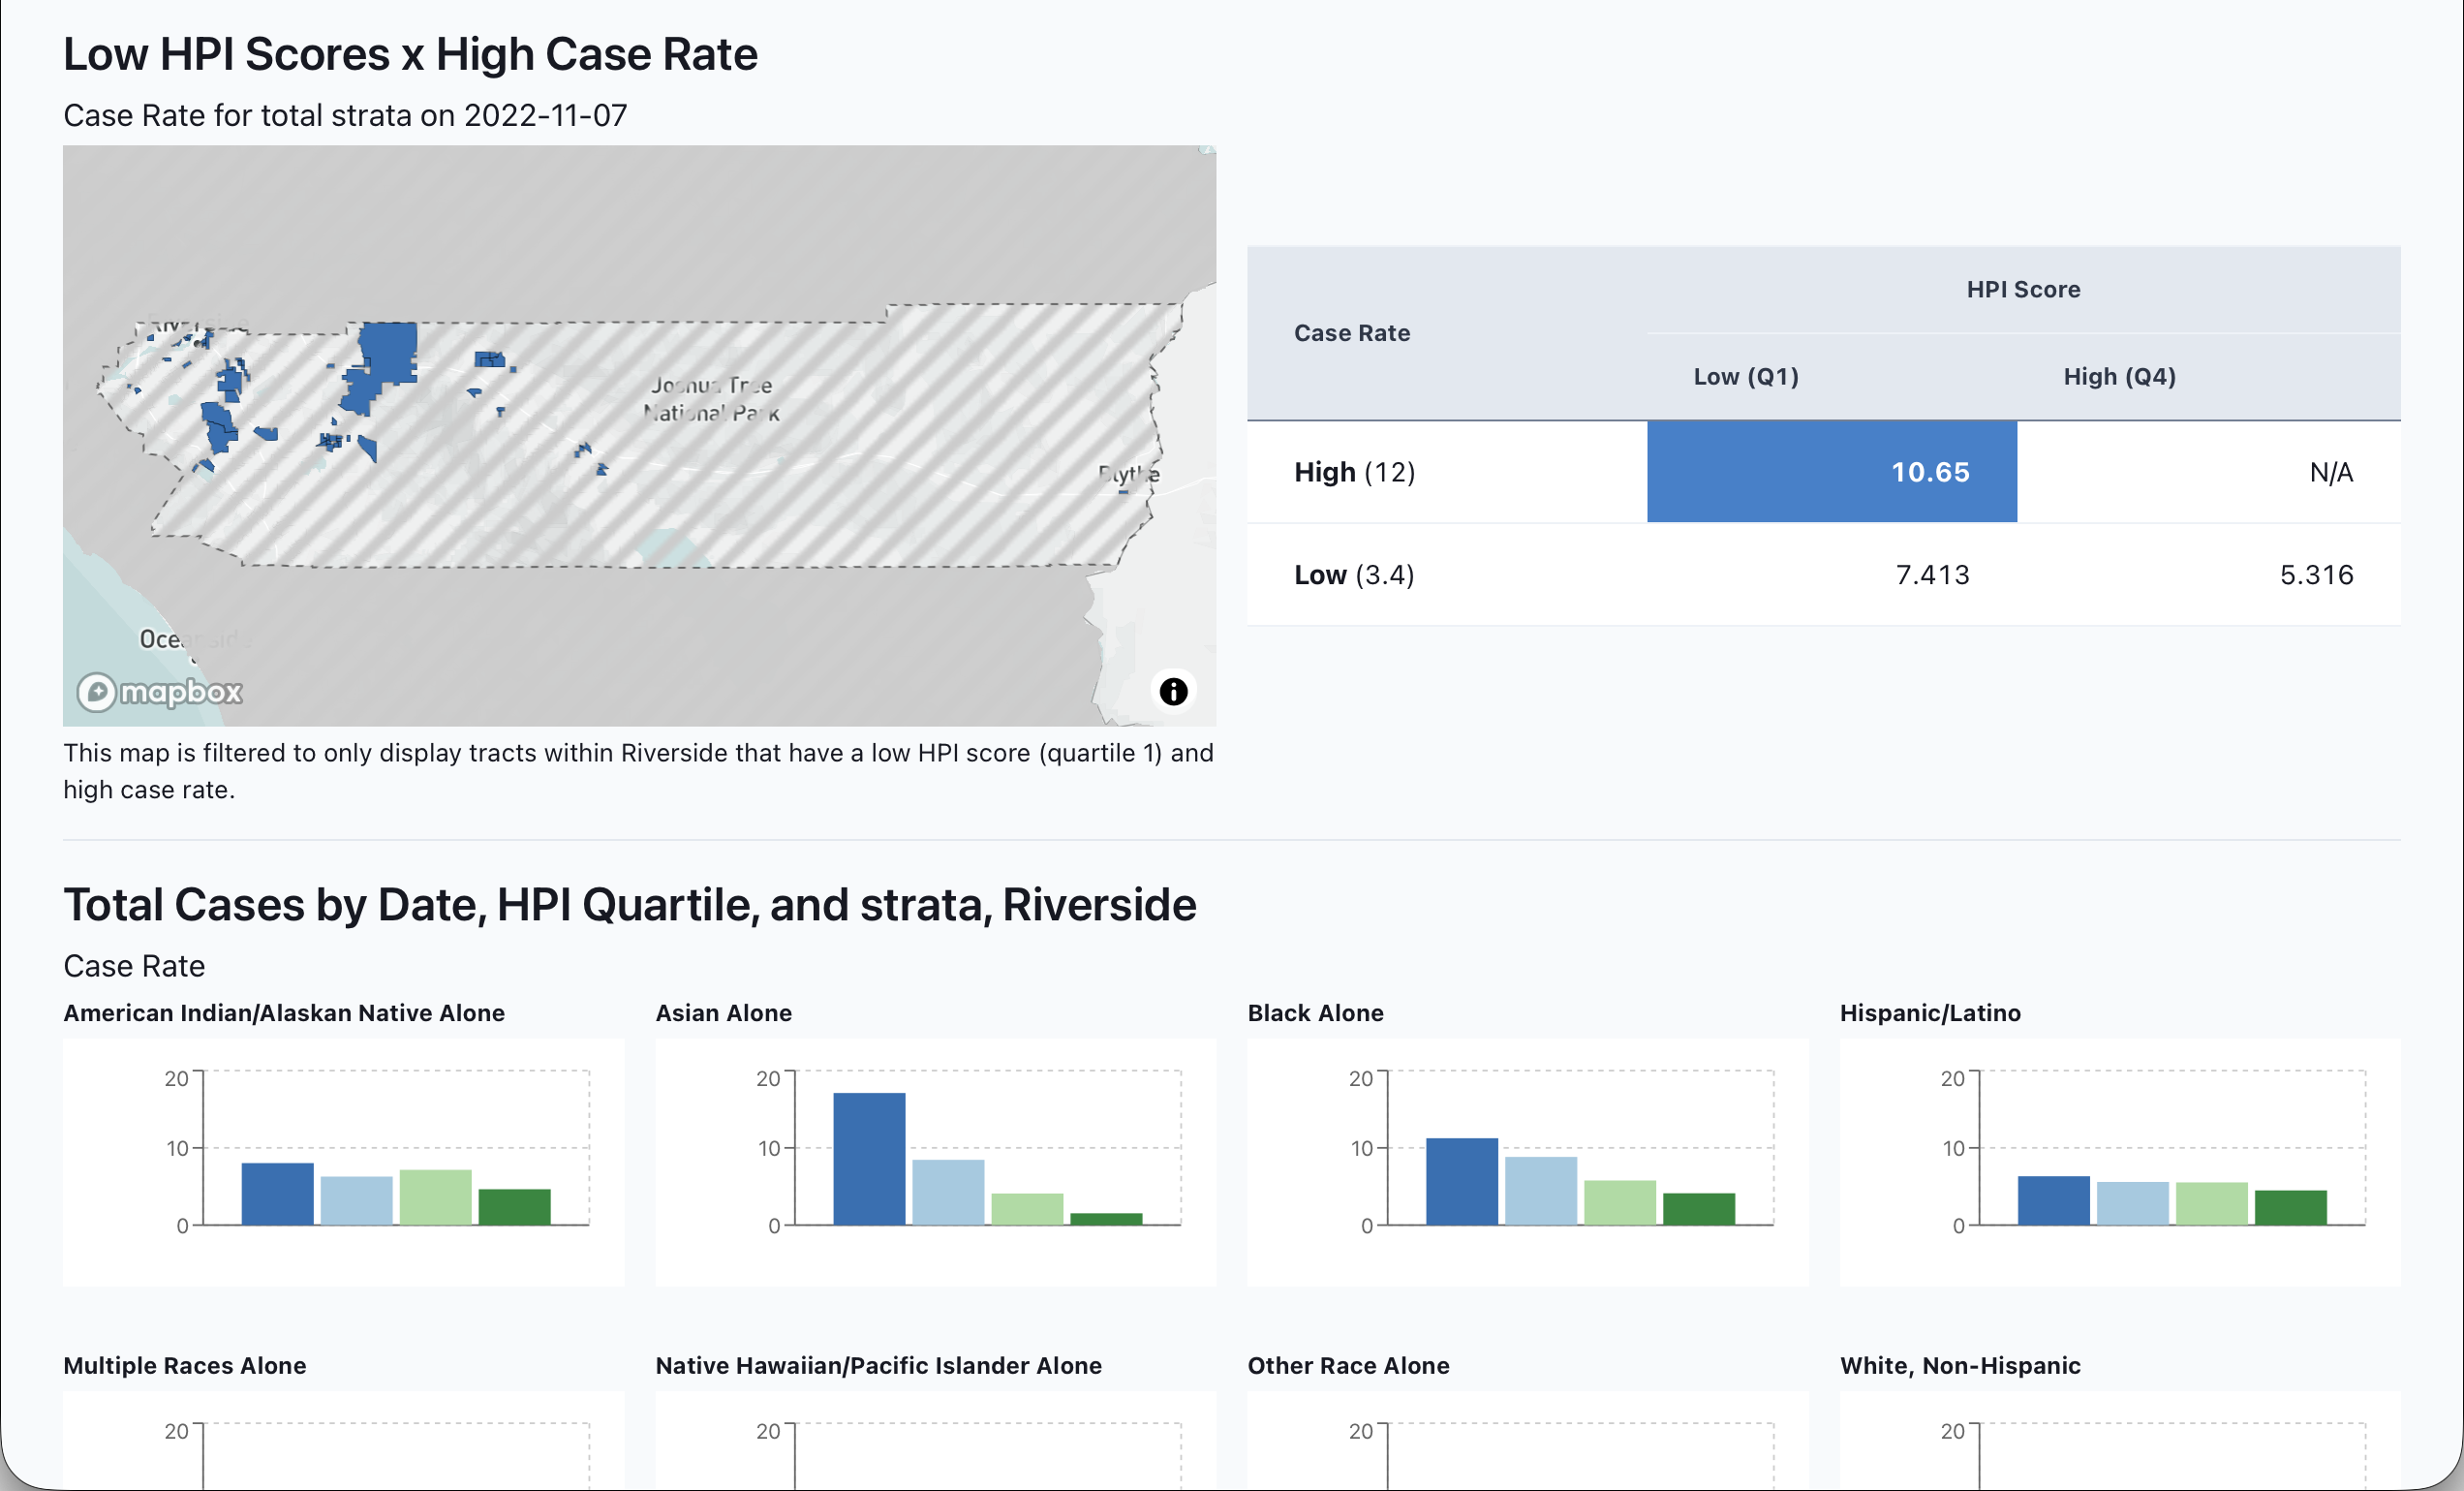
A critical public health tool within the atlas is the bivariate hotspot map, designed to identify counties requiring targeted intervention. This visualization highlights counties that have both vaccination rates below the national average of 70% and rotavirus-related medical encounter rates five times higher than the national average, allowing health officials to quickly locate areas where additional vaccination resources are needed. This feature transforms complex epidemiological data into actionable intelligence for public health decision-makers.
The technical architecture balances the massive scale of data with responsive web performance. The platform uses a PostGIS spatial database served through an ExpressJS API, with D3.js and Mapbox GL JS powering the visualizations. To handle over 40,000 zip codes and 1,100 weekly time points efficiently, we implemented innovative data compression techniques and on-demand loading strategies. The result is a smooth, interactive experience that works seamlessly across desktop and mobile devices, allowing public health professionals to explore the data whether in the office or in the field.
Published in Vaccine: X journal in 2021 as "Planning for monitoring the introduction and effectiveness of new vaccines using real-world data and geospatial visualization," the project has established a new paradigm for vaccine surveillance. The authors specifically noted the platform's potential application to COVID-19 vaccine monitoring, demonstrating how these visualization techniques could be proactively developed to track the utilization and impact of vaccines during emerging epidemics.
The Atlas of Rotavirus Prevalence represents a significant advancement in public health communication, showing how geospatial visualization can make complex epidemiological data accessible and actionable. By clearly demonstrating the relationship between vaccine uptake and disease reduction across time and geography, the platform provides compelling evidence of vaccine effectiveness while identifying areas where public health interventions are most needed.