Health Equity Illuminator
HIPAA-compliant health equity data visualization platform
The Health Equity Illuminator is a HIPAA-compliant data visualization platform that enables health departments to analyze surveillance data through an equity lens by integrating health outcomes with the Healthy Places Index. Developed for the Public Health Alliance of Southern California and initially deployed at Riverside University Health System, the platform transforms aggregated health data into actionable insights that guide equitable resource allocation and policy decisions.
The platform ingests geocoded health data aggregated at census tract or ZIP code tabulation area levels through a standardized CSV format. The system automatically links geographic identifiers to HPI scores and census denominators, calculating rates using either standard census indicators or custom population values. This flexible architecture supports diverse health metrics including disease surveillance, hospitalization rates, public health service utilization, and clinical quality measures—any metric with a numerator and denominator can be visualized through the equity framework.
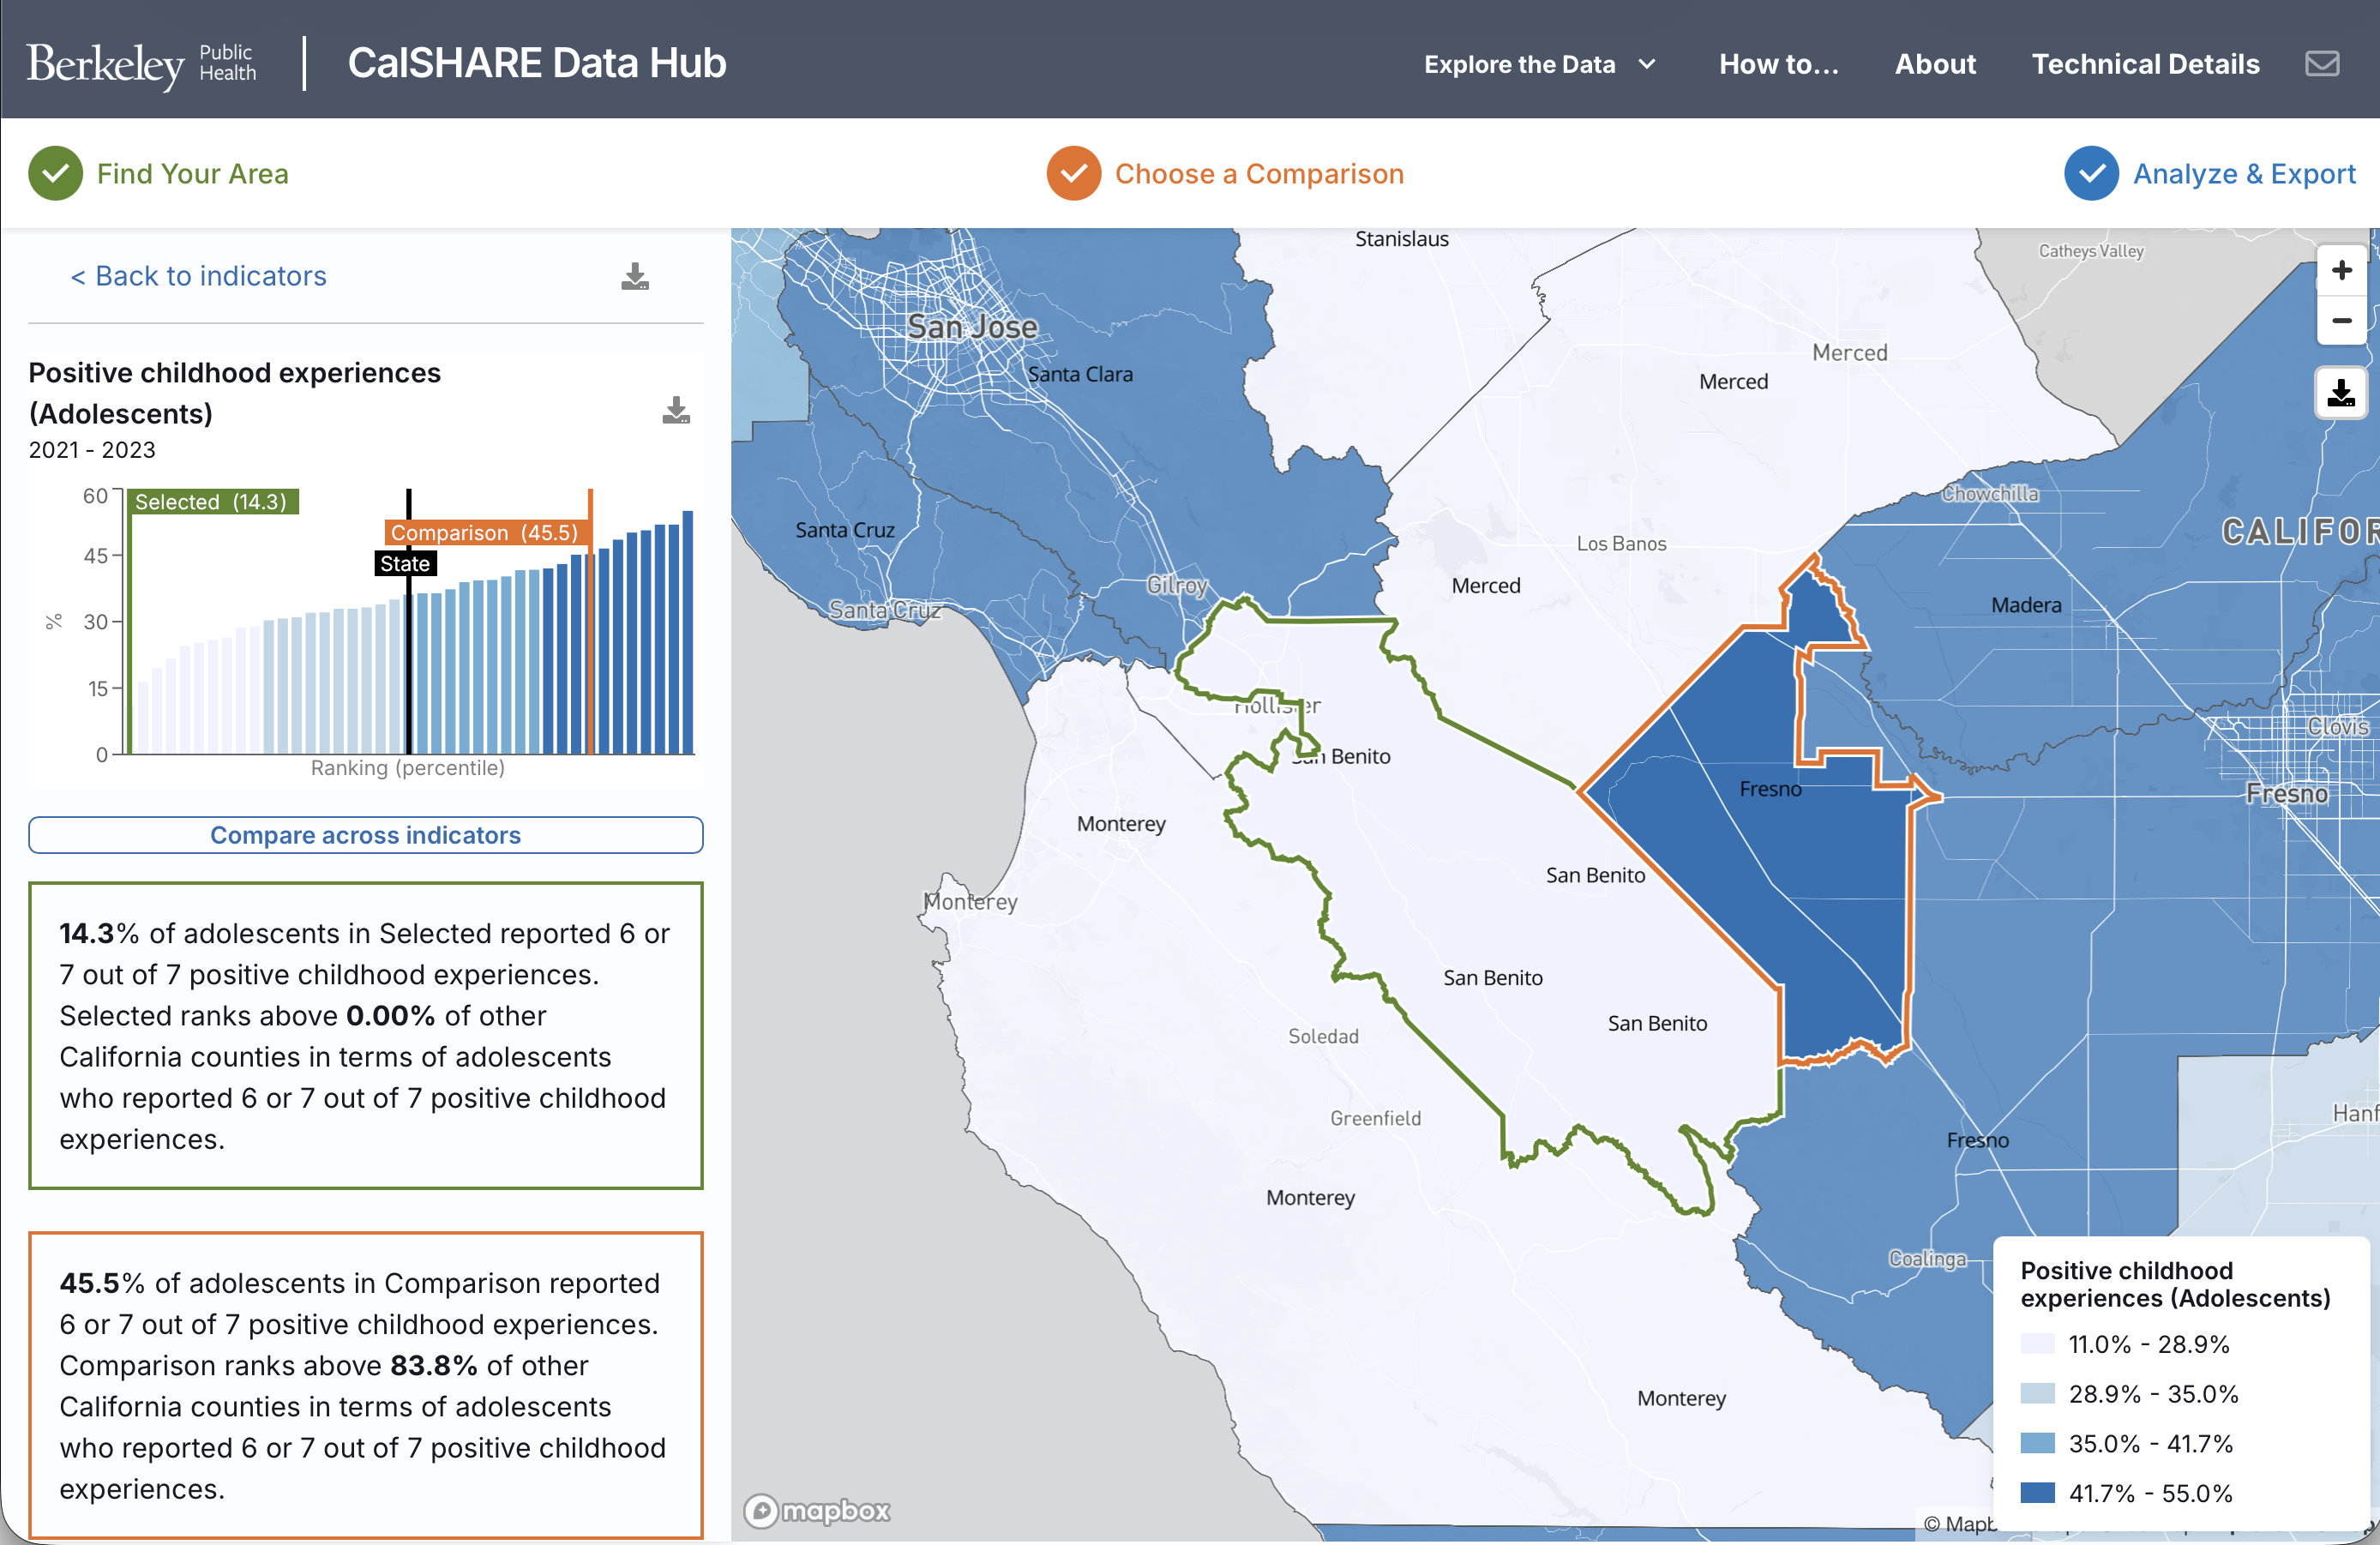
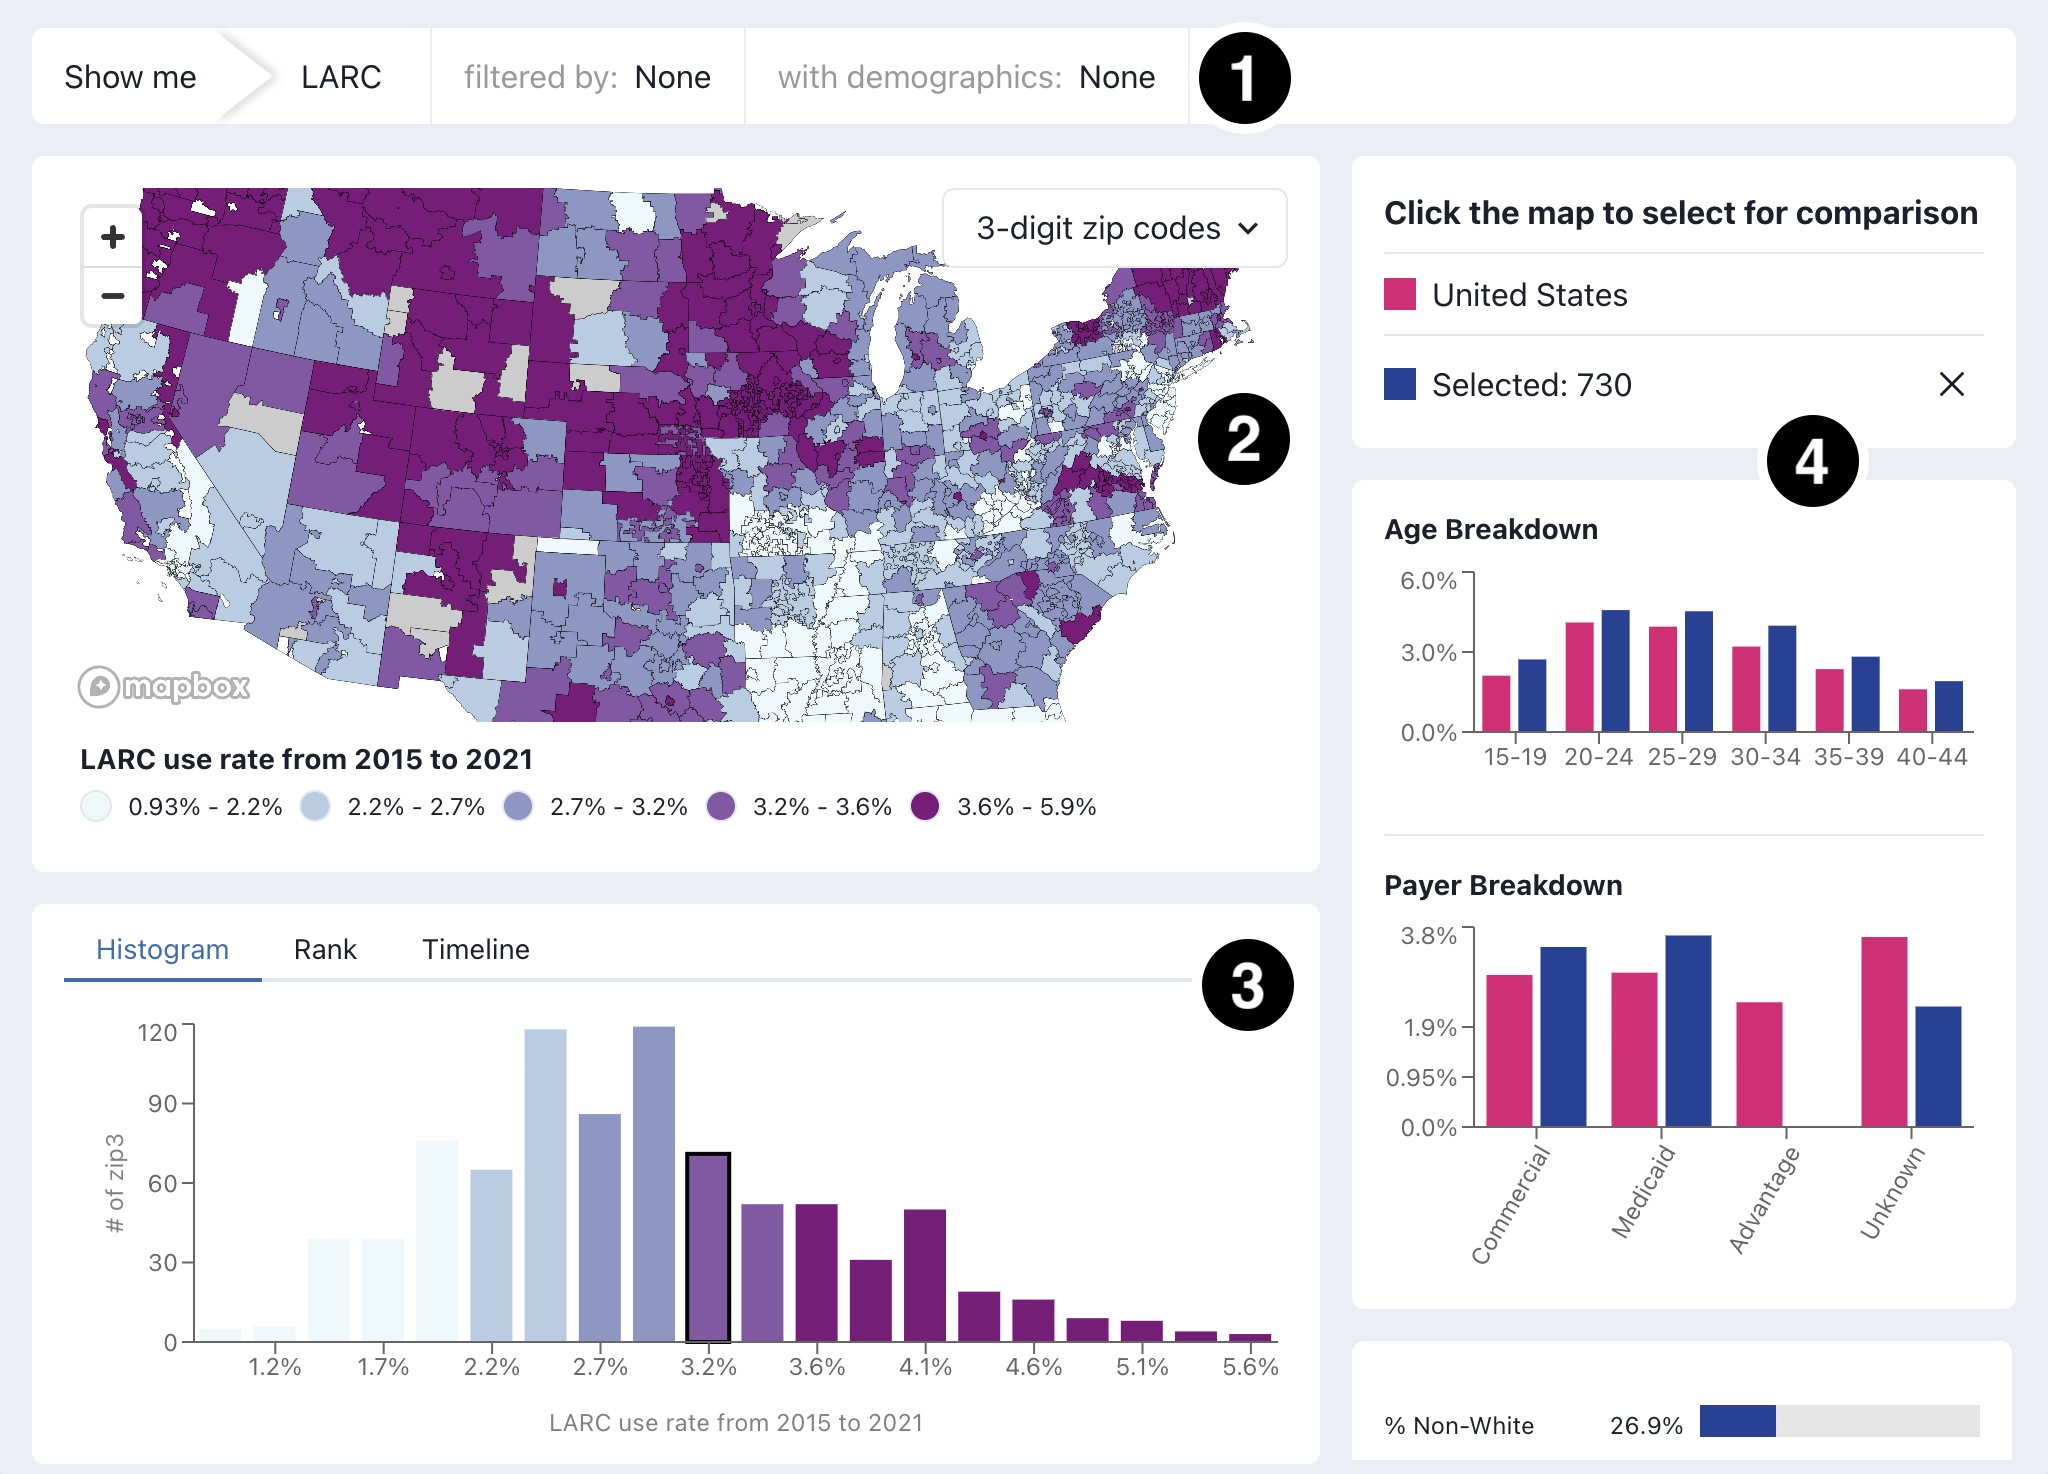
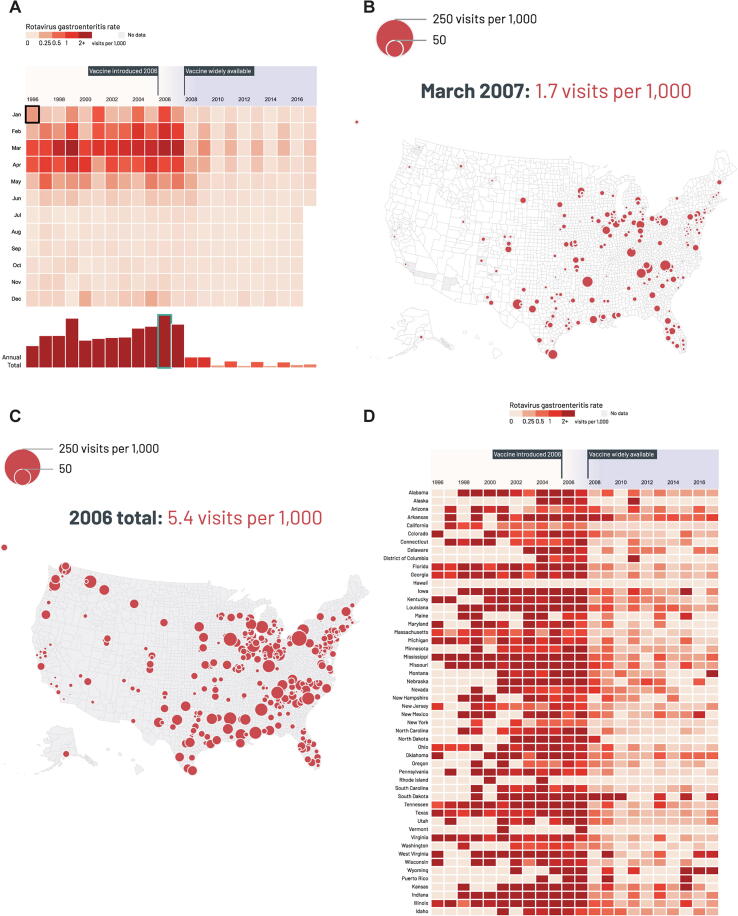
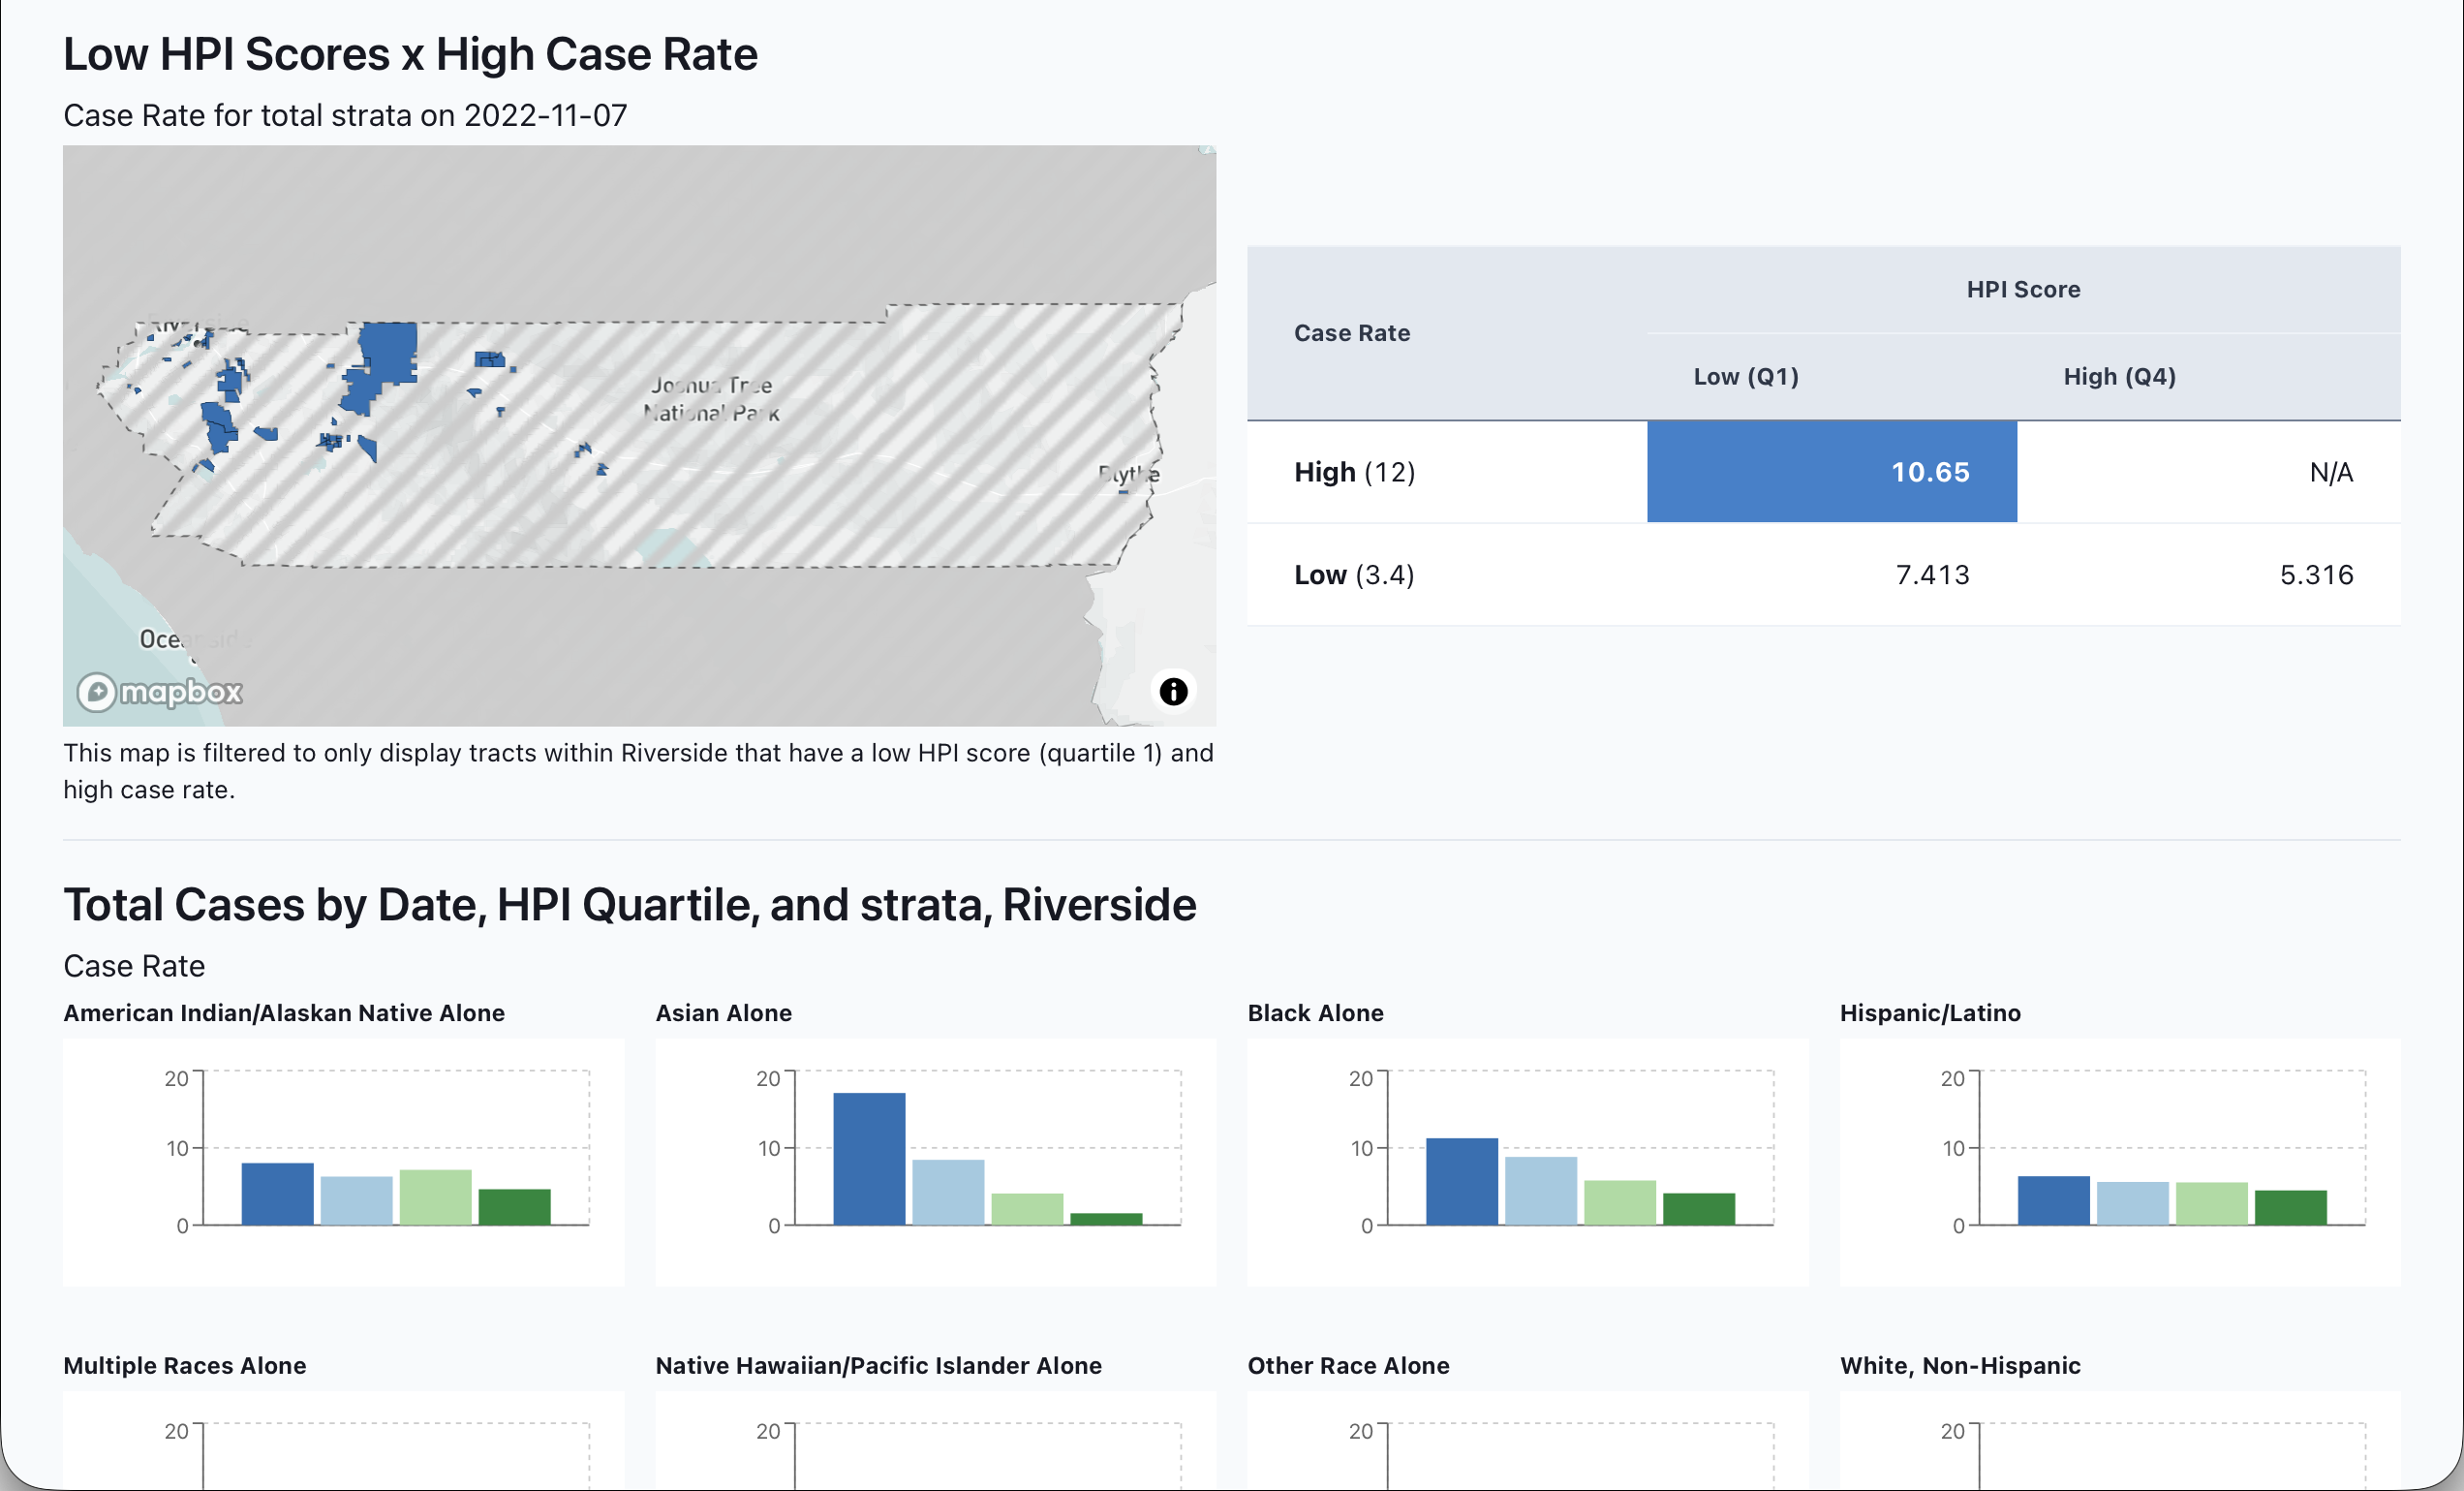
A dual-tier visualization system maintains data security while maximizing utility. Internal dashboards accessible only to authorized health department staff display detailed analytics including small geographic areas. The platform automatically applies statistical suppression thresholds before generating public-facing visualizations, ensuring patient privacy while preserving analytical value. Visualizations include choropleth maps of health outcomes, comparative bar charts across HPI quartiles, time series tracking disparity evolution, and bivariate maps highlighting the intersection of poor social conditions with adverse health outcomes.
The project management system enables health departments to create multiple analytical workspaces with distinct datasets, visualizations, and access controls. This modular approach allows different public health programs—infectious disease, chronic disease, maternal health, environmental health—to maintain separate analyses while leveraging shared infrastructure. Originally developed to track COVID-19 disparities, revealing that communities in the lowest HPI quartile experienced case rates up to six times higher than the highest quartile, the platform has expanded to support comprehensive health equity monitoring across Southern California health jurisdictions.