MapMaster 3
GIS-inspired digital atlas for geography and environmental science education
Pearson Education partnered with us to completely redesign and rebuild MapMaster 3, their flagship interactive mapping platform for geography and environmental science education. This GIS-inspired digital atlas enables students to layer thematic maps and analyze spatial patterns at regional and global scales, developing critical geographic literacy and data analysis skills essential for understanding our interconnected world.
The redesign prioritized accessibility from the ground up, introducing groundbreaking features that make geographic data available to all learners. The new Atlas mode transforms traditional map visualizations into fully interactive tabular data, allowing students using screen readers to sort, filter, and analyze the same geographic information as their peers. This accessibility-first approach extends throughout the interface, with high-contrast color schemes, keyboard navigation, and comprehensive ARIA labeling ensuring that no student is excluded from geographic learning.
MapMaster 3's technical architecture leverages state-of-the-art web mapping technology to deliver over 500 authoritative datasets from sources including the World Bank, United Nations, NASA, NOAA, and USGS. The platform serves both raster and vector data through a custom-built tile server optimized for educational environments with varying bandwidth. Our implementation includes intelligent caching strategies and progressive loading techniques to ensure smooth performance even when entire classrooms access the platform simultaneously.
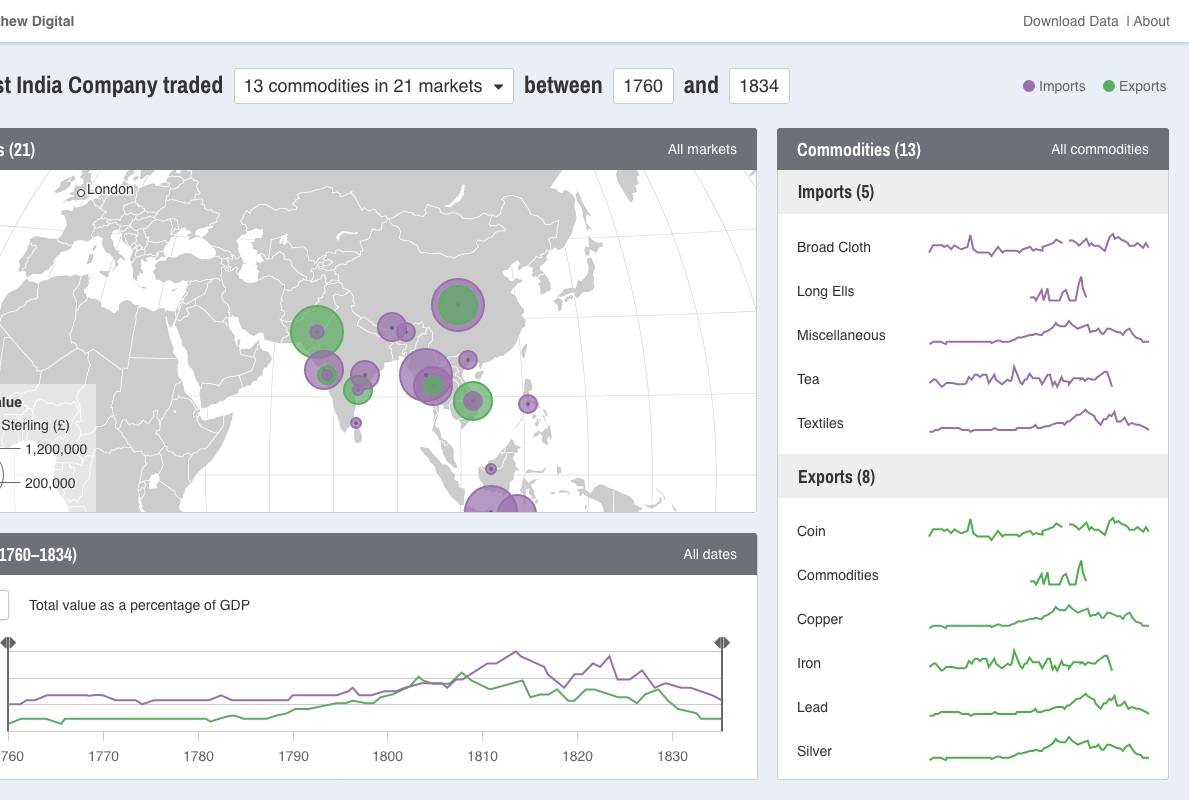
The interactive legend system allows students to explore data through multiple analytical lenses. Users can probe specific locations for detailed information, compare multiple datasets through split-screen views, perform bivariate analysis to understand relationships between variables, and create custom data classifications. The annotation tools transform maps from static displays into dynamic workspaces where students can add their observations, measure distances, and highlight patterns directly on the map canvas.
A sophisticated data import feature empowers instructors and students to extend the platform beyond its curated datasets. Users can upload their own CSV files or work with provided templates to add custom layers, enabling place-based learning with local data or supporting original research projects. The system automatically validates and geocodes uploaded data, matching it to the appropriate geographic boundaries and generating appropriate symbolization.
The platform seamlessly integrates with Pearson's Mastering learning management system while maintaining standalone accessibility for broader educational use. Maps created in MapMaster 3 can be shared via unique URLs that preserve all customizations, from selected layers and zoom levels to annotations and custom color schemes. The export system generates high-resolution images suitable for presentations and reports, ensuring that geographic analysis can extend beyond the digital classroom.
Additional features include:
- Multi-projection support including Mercator, Mollweide, and Robinson projections, each optimized for different analytical purposes
- Dynamic data filtering and custom score calculations that allow students to weight different indicators according to their research questions
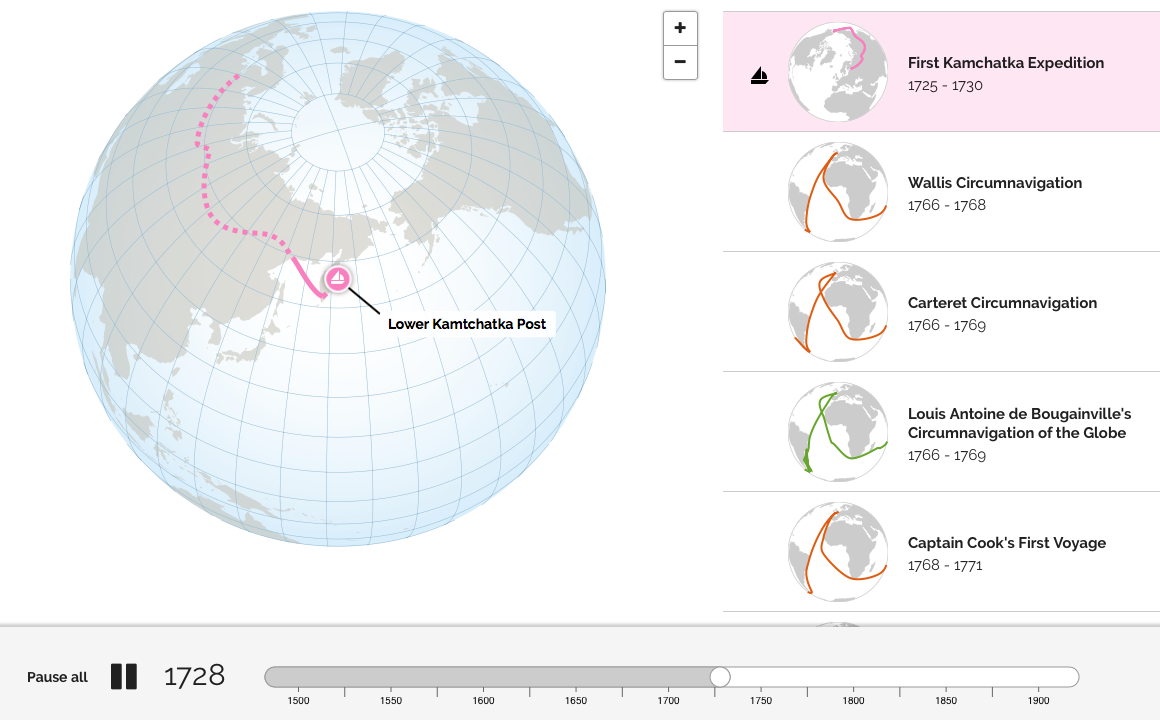
- Time-series animation for temporal datasets, revealing patterns of change in everything from climate data to demographic shifts
- Collaborative features enabling instructors to create and share custom map collections tailored to specific curriculum objectives
- Mobile-responsive design ensuring full functionality across tablets and smartphones for field work and on-the-go learning
- Comprehensive help system with embedded tutorials and contextual guidance supporting self-directed exploration