Transit Insights
Mapping and visualizing public transit ridership trends over time
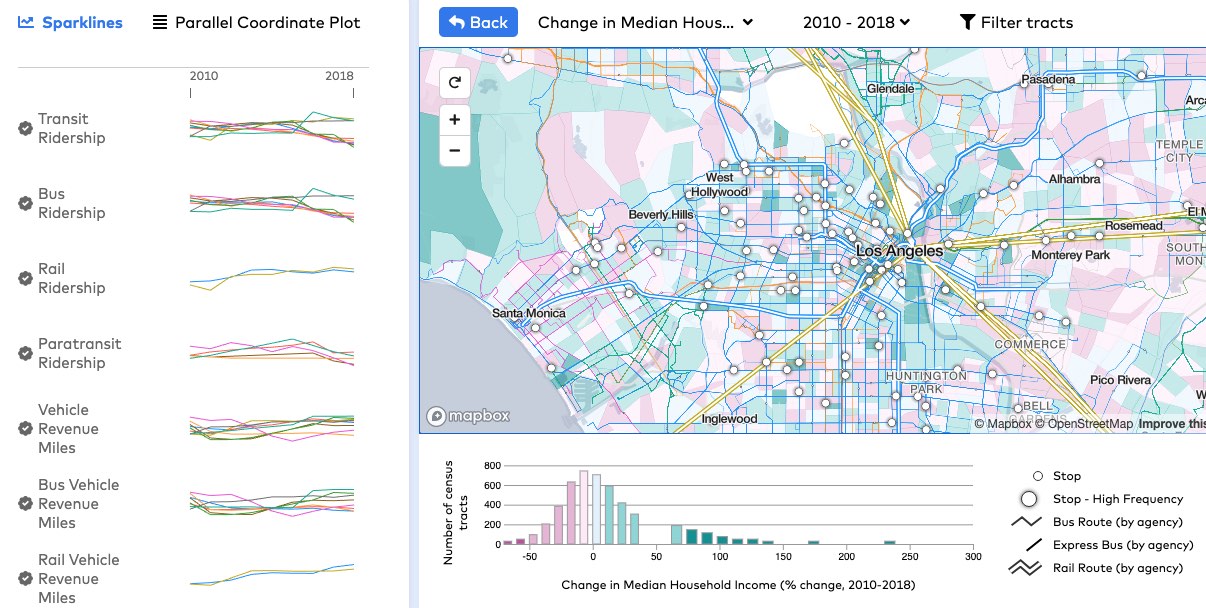
Transit Insights is a spatial and temporal tool for exploring trends in public transit ridership in the 55 most populous U.S. metropolitan areas since 2006, built for TransitCenter. In addition to ridership counts for several modes of transportation (such as rail and bus), the map and charts include a variety of other related transit and demographic data, as well as transit lines themselves.
The map and charts have two modes: a national overview and a single metropolitan area. The national map shows cities or transit agencies as proportionally sized circles clustered in metropolitan areas, indicating both a data value for a year (for example bus ridership) and the percent change in that value over time. Each metropolitan area map zooms into street level, showing the local transportation network overlaid with demographic data by census tract. In both cases, alongside the map are "sparkline" charts showing trends over time and a parallel coordinate plot for seeing relationships between different indicators. Everything is linked so that the map and all charts represent selections a user has made, such as time span and selected transit agencies.
A series of Python scripts load and process transit and demographic data into easily consumed formats. We also made use of Mapshaper's command line tools for processing geographic data. In the end, the web map loads tabular transit and demographic data, and topojson census tract shapes. The national map and all charts are built with D3, and metropolitan area maps use Mapbox GL JS, with basemap and transit lines delivered as vector tiles.